I’ve always felt unequipped to write about women’s football. Not that I don’t possess the knowledge about football, but that I don’t feel that I know the depts of women’s football enough to make an assessment. Or that people just didn’t want to hear about my thoughts about it.
I’ve let that thought go a bit now, but this is my first player analysis in the women’s game – and because the fact that I liked doing them on the men’s game, this will be equally fun for me. In this analysis I will look more closely to Chelsea FC’s Pernille Harder – more specifically, her attacking numbers in the WSL and her through passes in the 2020/2021 season.
Data analysis
In the data that I’m using all players that have played in the central attacking position in the Women’s Super League, 2020-2021 have been included. The reason is that Wysocut has set this as such, so that’s how I’ve taken it on. I’ve filtered them for >900 minutes played, as that’s enough, in my opinion, to make a good judgment on their data performances in the league. This leaves me with a total of 27 players to look at in data analysis. The data and videos have been retrieved on May 5th 2021.
Goals
In the scatterplot above we can see the metrics shots per 90 and shots on target % combined. It tells us how many shots are conducted per 90 and how well these shots are places – are they on target or not? Harder has 4,03 shots per 90 in the WSL this season with shots on target percentage of 40,35%. As seen in the image, you can see that only Kerr and Miedema have more shots per 90 minutes.
In the scatterplot above we can see the metrics expected goal per 90 and goals per 90. It tells us how big the probability of a shot being converted into a goal is and the actual goals being scored per 90. Harder hasa xG of 0,61 per 90 minutes with 0,64 goals scored per 90 minutes. This means that Harder scores more goals than would be expected on the quality of chances and shots. Only Foord, Miedema, Kirby and Kerr score more goals per 90.
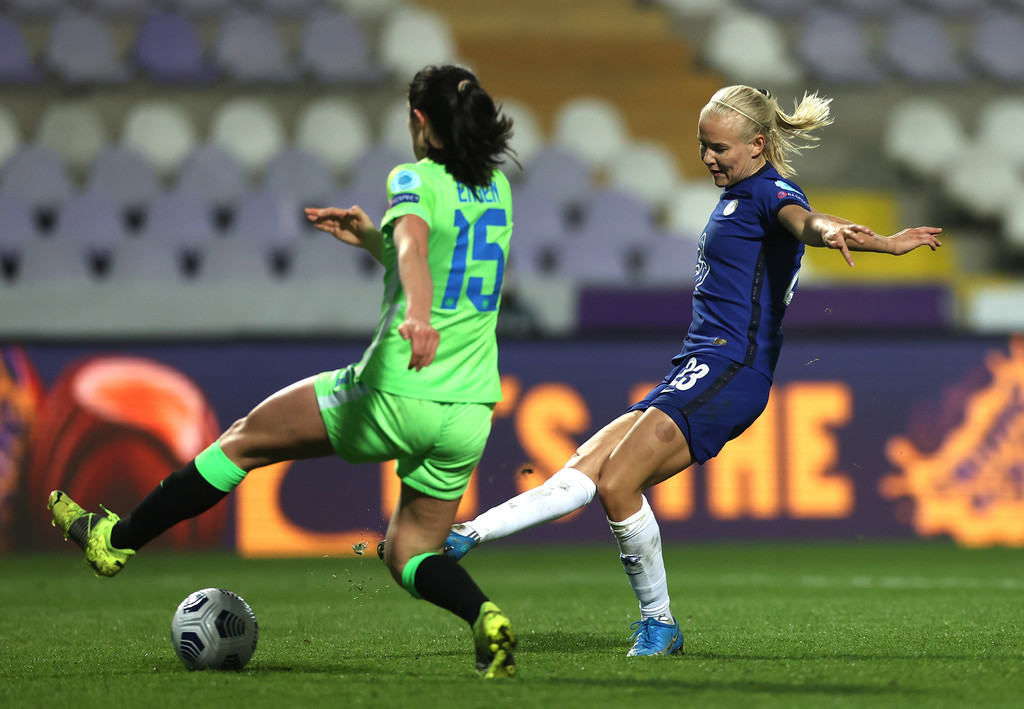
Pernille Harder has scored 20 goals in all competitions in the 2020/2021 season. In the Women’s Super League she has scored 9 goals with 1273 minutes played so far. In the video below I will show some of the goals that show how clinical she is and how she always comes in the right positions to score goals for Chelsea.
In the video above we see Chelsea in the attack on the right side with Harder in key role in the attack. She is constantly moving and scanning where the ball is and when the opposition doesn’t clear the ball sufficiently she steps up in the penalty area and with a piece of skill gets in an ideal position to score, which she does.
In this video we Chelsea attacking on the left side in the game against Arsenal. In this video we see that Harder positioned herself just outside the penalty area before penetrating that penalty area. The little movement she makes to get just enough space to get a good shot at goal, is what makes her an elite player rather than just a good player.
The movement is a key part of Harder’s game. In this set-piece above we see that she starts close to the six-yard box, but then drops deeper and deeper, just outside the penalty area, in order to get the ball and give herself enough space to adequately pull the trigger. This time she shoots with her left and her shot is precise – another goal for her.
Assists
In the scatterplot above we can see the metrics expected assists per 90 and assists per 90. It tells us how big the probability of a pass being converted into a goal is and the actual assisted being scored per 90. Harder hasa xA of 0,2 per 90 minutes with 0,21 assists per 90 minutes. This means that Harder has more assists than would be expected on the quality of chances and passes. Only Foord, Miedema, Kirby, and England have more assists per 90.
Pernille Harder has assisted 7 goals in all competitions in the 2020/2021 season. In the Women’s Super League she has assisted 3 goals with 1273 minutes played so far.
Key passing
In the graph below you can see the percentile ranks of Harder compared to the 27 players in my database. This shows in which percentile she is for every metric that belongs to the key passing side of the game.
As you can see in the graph, Harder is really good. She scores excellent in all the metrics against the players in his position who have played more than 900 minutes. She ranks above the 75th percentile in every key passing rank looked at and if we don’t look at the expected assists per 90, she even ranks 80th in every rank. Very impressive in this season so far.
This can also be seen in the beeswarmplot below. This visual shows us the same information, but the visual is slightly different as it visually shows us where the players are in terms of the metric and shows us how far ahead Harder actually is.
Through passes
As displayed in the title of this piece, this analysis is partly concentrated on the through passes of Harder. Until now I’ve analysed a lot of different passes, more specifically her key passing and goal. Now, I’m going to show her variety of through passes via 5 video examples.
In the video above we see Chelsea in their game against Manchester City. This shows two things in the through pass of Harder. She shows that she can play a through pass under pressure of the opposition and it shows that she can scan where the other attacking players are making their run, and she can play the ball behind the defence.
In the video above we see Chelsea in their game against Aston Villa. We see Harder on the left side getting the ball and at the same time she sees Kerr sprinting towards the penalty area. This particular shows that Harder has the technique and touch to gently nudge it past the defenders and to create a goalscoring opportunity for her team mates.
In the video above we see Chelsea against Everton. In this particular example Harder is playing in midfield at the moment she receives the ball, and moves forward. She spots her team mate running in behind and Harder pass the ball through the defence – with her left foot- to create another great goalscoring opportunity.
In the video above we see Chelsea in their game against Tottenham. Chelsea presses Tottenham as soon as the ball is with the opposition and Harder gets the ball just outside zone 14 and picks out Kerr again, this time swinging the ball into the six-yard box, to create another great scoring opportunity.
In the video above we see Chelsea play against Brighton and Hove Albion. In this particular case, Harder is pressing aggressively after which she regains possession of the ball and immediately sets up a dangerous attack by giving a through ball into the penalty.
Final thoughts
Pernille Harder has already proven in previous seasons to be an outstanding player, but in this season she is doing great things for the very successful Chelsea team and doing great overall in the WSL. She has adapted really well and it seems like she will only grow going forward.
I live in the Netherlands and that’s definitely not a surprise to many, but it does make me feel a bit weird towards Belgian football. I’ve always been told that we are ‘better’ than Belgian football and we should always strive to be better than them. I’m not sure this is because of historic sentiment or banter, but this has clouded me for a long time. Not anymore, I genuinely love Belgian football and that’s why I started to look at the leagues more closely.
In this set-piece analysis my eyes turn towards the attacking set-pieces of OH Leuven, playing in the Jupiler Pro League. They have been very interesting in their attacking routines, but in this piece I’m trying something different too.
First, I will look at the generated expected goals per corner per 90. I will look at their last 12 games to do that. After that I will look at the average expected goals generated per 90 per corner type, which I will explain later on. Then, I will have a look at the deliveries of the last 50 corners in those 12 games, to show where the first contact is and when a shot has been released. And finally, I will look at the successful corner routines during the 2020-2021 season.
Expected goals per corner
OH Leuven vs Waasland Beveren
Game
Side
Foot
Swing
Zonal structure
Length
Zone
xG
Goal
Minute
Waasland-Beveren
Right
Left
In
Two man
Short
Central
0
No
7
Waasland-Beveren
Left
Right
In
Two man
Long
Central
0,18
No
35
Waasland-Beveren
Left
Right
In
Two man
Long
Front post
0
No
64
Waasland-Beveren
Right
Right
Out
Two man
Long
Central
0,24
No
87
Waasland-Beveren
Right
Right
Out
Two man
Short
Front post
0
No
93
In the table above we see the attacking corners conducted in the game against Waasland-Beveren. We see that there is a total of 0,42 xG generated from attacking corners in this game and that both of these corners were long and delivered to the central zone of the penalty area.
OH Leuven vs Cercle Brugge
Cercle Brugge
Right
Right
Out
Two man
Long
Far post
0
No
22
Cercle Brugge
Right
Left
In
Three man
Short
Front post
0
No
26
Cercle Brugge
Left
Right
In
Two man
Long
Far post
0
No
30
Cercle Brugge
Left
Left
Out
Two man
Short
Central
0,06
No
52
Cercle Brugge
Left
Right
In
Two man
Long
Central
0
No
52
Cercle Brugge
Left
Right
In
Two man
Long
Central
0
No
54
Cercle Brugge
Right
Right
Out
Two man
Long
Far post
0
No
59
Cercle Brugge
Right
Right
Out
Two man
Long
Central
0
No
69
Cercle Brugge
Left
Right
In
Three man
Short
Central
0
No
92
In the table above we see the attacking corners conducted in the game against Cercle Brugge. We see that there is a total of 0,06 xG generated from attacking corners in this game and that the particular corner in questions was conducted from the left and played short, after which it was delivered to the central zone.
OH Leuven vs KRC Genk
Genk
Right
Right
Out
Two man
Long
Central
0
No
16
Genk
Left
Right
Out
Five man
Short
Front post
0,01
No
56
Genk
Right
Right
Out
Five man
Short
Front post
0
No
64
Genk
Left
Left
Out
Three man
Short
Front post
0
No
70
Genk
Right
Right
Out
Six man
Long
Central
0
No
77
Genk
Right
Right
Out
Five man
Short
Far post
0,07
No
79
Genk
Left
Right
In
Five man
Short
Front post
0
No
80
In the table above we see the attacking corners conducted in the game against Genk. We see that there is a total of 0,08 xG generated from attacking corners in this game and that the two corners in question were both short corners, with one delivered to the front post and one delivered to the far post.
OH Leuven vs KV Mechelen
Mechelen
Left
Right
In
One man
Long
Central
0
No
16
Mechelen
Right
Right
Out
One man
Short
Central
0,02
No
66
Mechelen
Right
Left
In
One man
Short
Central
0,01
No
84
In the table above we see the attacking corners conducted in the game against Mechelen. We see that there is a total of 0,03 xG generated from attacking corners in this game and that the two corners in question were both short corners, with both corners delivered to the central zone.
OH Leuven vs KAS Eupen
Eupen
Left
Right
In
Four man
Short
Front post
0
No
4
Eupen
Left
Right
In
One man
Long
Central
0
No
23
Eupen
Left
Right
In
Four man
Short
Central
0,05
No
59
Eupen
Right
Left
In
Three man
Short
Central
0
No
69
Eupen
Right
Right
Out
Three man
Long
Far post
0
No
91
Eupen
Right
Right
Out
Three man
Long
Central
0
No
97
In the table above we see the attacking corners conducted in the game against Eupen. We see that there is a total of 0,05 xG generated from attacking corners in this game and that the corner in question was played short and to a central zone.
OH Leuven vs Royal Antwerp
Antwerp
Left
Right
In
Two man
Long
Far post
0,02
No
21
Antwerp
Right
Left
In
Three man
Short
Front post
0
No
36
In the table above we see the attacking corners conducted in the game against Antwerp. We see that there is a total of 0,02 xG generated from attacking corners in this game and that the corner in question was played long and to the far post.
OH Leuven vs Club Brugge
Club Brugge
Right
Right
Out
Two man
Long
Front post
0
No
34
Club Brugge
Right
Right
Out
Three man
Long
Central
0
No
47
Club Brugge
Right
Right
Out
Four man
Short
Front post
0
No
52
Club Brugge
Right
Right
Out
Four man
Short
Front post
0
No
53
Club Brugge
Right
Right
Out
Four man
Short
Front post
0
No
68
In the table above we see the attacking corners conducted in the game against Club Brugge. We see that there is a total of 0 xG generated from attacking corners in this game and that there were no deliveries to the far post.
OH Leuven vs KV Kortrijk
Kortrijk
Right
Right
Out
One man
Long
Central
0
No
6
Kortrijk
Right
Left
In
Two man
Short
Central
0,13
Yes
20
Kortrijk
Left
Left
Out
Four man
Short
Front post
0
No
62
In the table above we see the attacking corners conducted in the game against Antwerp. We see that there is a total of 0,13 xG generated from attacking corners in this game and that the corner in question was played short and to the central zone. In the end this leads to a goal scored by Henry
OH Leuven vs Standard Liege
Standard Liege
Right
Right
Out
One man
Long
Far post
0,06
No
11
In the table above we see the attacking corners conducted in the game against Standard. We see that there is a total of 0,06 xG generated from attacking corners in this game and that the corner in question was played long and to the far post.
OH Leuven vs Beerschot
Beerschot
Right
Right
Out
Three man
Long
Central
0
No
10
Beerschot
Right
Right
Out
Three man
Short
Front post
0
No
33
Beerschot
Left
Right
In
Three man
Long
Central
0
No
61
Beerschot
Left
Right
In
Two man
Long
Central
0
No
80
Beerschot
Left
Right
In
Three man
Short
Front post
0
No
80
Beerschot
Right
Right
Out
Four man
Short
Central
0,04
No
81
In the table above we see the attacking corners conducted in the game against Beerschot. We see that there is a total of 0,04 xG generated from attacking corners in this game and that the corner in question was played short and to the central zone.
OH Leuven vs Charleroi
Charleroi
Left
Left
Out
Five man
Short
Front post
0
No
3
Charleroi
Right
Left
In
Five man
Short
Central
0,09
No
32
Charleroi
Right
Right
Out
Four man
Long
Front post
0
No
36
Charleroi
Right
Left
In
Five man
Short
Front post
0
No
37
Charleroi
Right
Right
Out
Five man
Long
Central
0
No
80
In the table above we see the attacking corners conducted in the game against Charleroi. We see that there is a total of 0,09 xG generated from attacking corners in this game and that the corner in question was played short and to the central zone.
OH Leuven vs KAA Gent
Gent
Left
Right
Out
One man
Short
Front post
0
No
30
Gent
Left
Left
Out
Two man
Short
Front post
0,13
No
66
Gent
Left
Left
Out
One man
Short
Front post
0
No
66
In the table above we see the attacking corners conducted in the game against Gent. We see that there is a total of 0,13 xG generated from attacking corners in this game and that the corner in question was played short and to the front post.
Average expected goals per corner type
Corner type
Total xG
Average xG
Left
0,45
0,038
Right
0,66
0,055
Swing in
0,48
0,04
Swing out
0,63
0,053
Short
0,61
0,051
Long
0,5
0,042
Front post
0,14
0,012
Central
0,82
0,068
Far post
0,15
0,013
One man zonal
0,09
0,008
Two man zonal
0,56
0,047
Three man zonal
0
0
Four man zonal
0,09
0,008
Five man zonal
0,17
0,014
Six man zonal
0
0
In the table above I’ve divided the corners into certain categories to assess how many xG has been generated per corner type. If we look at which side is most successful in generating that xG, then this is the right side. When we look whether short or long corners generate the most xG, then it is the short corner option.
When we have a look at which zone – the ball is being delivered into – generates the most xG in these games, then we can conclude that the central zone generates the most xG. Finally, if we look at the successful generating xG against certain zonal structures, we can conclude that OH Leuven generates the most xG against two player zonal structures in the six-yard box.
Successful corner routines
The analysis of the corners in video will happen below, but I have a few things to say. Against Kortrijk, there was a goal scored from a corner – but that doesn’t show up in the delivery. The reason for this is that there have been a few passes before the cross came, hence the position of every player is different to the corner set up.
What I also wanted to say is that the games against Waasland-Beveren and Gent, are not the same as analysed above with the xG generated per game.
In the video above we see attacking corner routine #1 from OH Leuven in their game against Kortrijk. The corner comes from the right from a left-footed player, meaning the ball will swing in towards the six-yard box, rather than swing out. The position of the runners is more advanced because the ball will go towards the six-yard box.
In the penalty area we see two players on the right closer to the kick taker, two players just inside the penalty area, and one player on the penalty spot. Just outside the penalty are we have another player who will anticipate any cleared balls and/or tasked with the first line of the rest-defence. There also is an option for the short pass option, to take the corner quickly.
As soon as the ball is kicked we see that Leuven opts for the short pass option and that players are overlapping on the right and left side from the player on the ball. The ball goes into the central zones of the penalty area where we see the highlighted player winning the duel. He is strong in the air and lures the defending players to him, creating space for the player at the far post. Eventually the latter gets the ball and scores a great goal for Leuven.
In the video above we see attacking corner routine #2 from OH Leuven in their game against Mouscroun. The corner comes from the left from a left-footed player, meaning the ball will swing out towards the penalty box, rather than swing in. In this example it’s quite clear that the ball will be played short to the player close to the kick taker.
In the penalty area, we see two players just inside the penalty area and also two players on the penalty spot, as well as another player in the six-yard box. Just outside the penalty area, we have another two players who will anticipate any cleared balls and/or tasked with the first line of the rest-defence. There also is an option for the short pass option, to take the corner quickly – which is obviously used in this example.
As soon as the ball is with the player that receives the short pass, he prepares to swing the ball into the box. We see a total of five players preparing to attack the cross. The ball does land in the central to far post zone, after which the ball is headed to the near post again. The three players at that near post have outpaced their markers and have space and time to score a goal.
In the video above we see attacking corner routine #3 from OH Leuven in their game against STVV. The corner comes from the right from a left-footed player, meaning the ball will swing in towards the penalty box, rather than swing out. In this example it’s quite clear that the ball will be played short to the player close to the kicktaker.
We have one player for the short pass option and one player just arriving outside the penalty area, who will make a run in the penalty area. Just inside the penalty area we have a unit of four players who are tasked with making runs into the six-yard box, and one player is on the left just outside the six-yard box.
As soon as the ball is kicked, into the player arriving in the penalty area, movement in that unit starts towards the central zone. The pass is played directly into the six-yard box and confuses the defensive organisation of STVV. At the end, the highlighted player gets at the end of the pass and converts the pass into a goal.
In the video above we see attacking corner routine #4 from OH Leuven in their game against Gent. The corner comes from the right from a left-footed player, meaning the ball will swing in towards the penalty box, rather than swing out. In this example it’s quite clear that the ball will be played short to the player close to the kicktaker.
We see the player for the short pass option who receives the ball. In the box we see three players who are man-marked, and are going to make runs into the six-yard box when the cross comes from the right. Just outside the box we see two players tasked with cleared balls and/or the first line of defence in case of a counter-attack.
The player who receives the ball passes the ball back to the corner taker who has progressed more to the left side. From that position, he can swing the ball into the far post where a unit of four players made runs forward, but the player doesn’t cross it. Instead, he shoots and scores against Gent.
In the video above we see attacking corner routine #5 from OH Leuven in their game against Waasland-Beveren. The corner comes from the right from a left-footed player, meaning the ball will swing in towards the penalty box, rather than swing out. In this example it’s quite clear that the ball will be played short to the player close to the kicktaker.
We see the player for the short pass option who receives the ball. In the box we see six players who are man-marked, and are going to make runs into the six-yard box when the cross comes from the right. There is a two player zonal structure in the six-yard box, so the delivery needs to good as well as the runs in that six-yard box.
The player who receives the ball passes the ball back to the corner taker who has progressed more to the left side. From that position, he can swing the ball into the far post where a unit of four players made runs forward, but the player doesn’t cross it. Instead he makes moves forward into the penalty area and shoots to the far post. His shot is successful and he scores for OH Leuven.
Final thoughts
OH Leuven was often mentioned as one of the most exciting teams to look at in terms of attacking corner routines, and they were absolutely right. Not only were there successful routines widely varied, but to look at which type of corner generated the most expected goals was a new thing for me to look at, but a very happy development as well.
Another monday, another article on set-pieces. This time I travel to Scandinavia and focus on the clubs in Denmark. In this article I will talk about the attacking set-pieces, corners to be precise, by Odense BK. They play in the Danish Superligaen in the 2020-2021 season.
In this analysis, I not only look at the successful corners routines that have resulted in a goal, but I also look at the deliveries of the set-pieces: where did they go, which were used the most and what the first ball contact was like. I’ve looked at the last 50 attacking corners Odense haven taken and made the analysis below. The video footage is from Wyscout.
Odense BK vs AalborgBK
In the video above we see attacking corner routine #1 from Odense in their game against Aalborg. The corner comes from the right from a left-footed player, meaning the ball will swing in towards the six-yard box, rather than swing out. The position of the runners is more advanced because the ball will go towards the six-yard box.
In the six-yard box, we see two players against a two-player zonal structure with two man-markers. Just outside the six-yard box, there is another player who makes a run forward. On the penalty spot, we see two players who are trying to make a run forward against their man-makers. There is another play who is standing far outside the penalty area, who is tasked with the first line of rest-defence.
As soon as the ball is kicked we see that the unit of two that is positioned on the penalty spot makes their run forward. They both move towards the front post zone, as are two players in the six-yard box. What follows is that the unit of two runners breaks and #20 goes more centrally in order to attack the ball. Eventually he scores the goal after this particular routine.
Odense BK vs Aalborg BK
In the video above we see attacking corner routine #2 from Odense in their game against Aalborg. The corner comes from the right from a left-footed player, meaning the ball will swing in towards the six-yard box, rather than swing out. The position of the runners is more advanced because the ball will go towards the six-yard box.
There is a little difference in set up compared to routine #1. In the six-yard box, we see two players against a two-player zonal structure with two man-markers. Just outside the six-yard box, there is another player who makes a run forward. On the penalty spot, we see three players who are trying to make a run forward against their man-makers. There is another play who is standing outside the penalty area, who is tasked with the first line of rest-defence and to attack cleared balls. In the penalty area a players moves deeper after he isn’t chosen for the short pass option.
As soon as the ball is kicked we see a lot of movement to the near post, but the deciding factor in this set-piece is the way Odense tries to overload the six-yard box in the front post zone and in the central zone. With six players in and around the box they want to create numbers in the box, and force something. In the end the ball is not cleared well enough and Odense scores the goal.
Odense BK vs AC Horsens
In the video above we see attacking corner routine #3 from Odense in their game against AC Horsens. The corner comes from the right from a left-footed player, meaning the ball will swing in towards the six-yard box, rather than swing out. The position of the runners is more advanced because the ball will go towards the six-yard box.
In the six-yard box, we see one player against a two-player zonal structure with one man-marker. On the penalty spot, we see six players who are trying to make a run forward against their man-markers. There is another play who is standing outside the penalty area, who is tasked with the first line of rest-defence and to attack cleared balls.
As soon as the ball is kicked we see a certain movement from the runners. The unit of six becomes a unit of five. The player that breaks off goes to the front post together with the player already in the six-yard box. The unit of five moves toward the far post and in the crowd they manage to shoot the ball into the net, a goal is scored for Odense BK.
Odense BKvs SønderjyskE
In the video above we see attacking corner routine #4 from Odense in their game against SønderjyskE. The corner comes from the left from a right-footed player, meaning the ball will swing in towards the six-yard box, rather than swing out. The position of the runners is more advanced because the ball will go towards the six-yard box.
In the six-yard box, we see four players On the penalty spot, we see two players who are trying to make a run forward against their man-markers. Just outside the six-yard box there is another player. Finally, there is another play who is standing outside the penalty area, who is tasked with the first line of rest-defence and to attack cleared balls.
As soon as the ball is kicked we see the four-man unit in the six-yard box move to the front post, opening up space in the central zone and in the far post zone. There is even more space created because the player just outside the six-yard box moves to the central zone as well – making it easier for the unit of two on the penalty spot, to move forward into that space. In the end, this results in another goal for Odense.
One of the things that I wanted to do more in 2021 was to explore more. With exploring I mean looking at leagues that I didn’t look at before, especially leagues that do not figure in Europe. When looking to non-traditional covered leagues, I tend to look at the top tier leagues – but that is changing now. That’s why I’m focussing my next set-piece analysis on North-America, the United States to be precise.
The MLS is the obvious choice to look at, but I wanted to delve deeper into different levels of football in the United States and that’s why I have chosen to look at the USL Championship – the second tier of the closed system in the United States. Because only one matchday has passed, I’m looking at a few interesting corner routines from just a few clubs, to have an idea of what their routines are.
Louisville City FC vs Atlanta United II
In the video above we Louisville City in their game against Atlanta United II. The corner is taken from the left by a right-footed player, which means the ball will swing in rather than swing out. This also means that the ball is more likely to be delivered in the six-yard box and this can be seen by the number of players in and around the six-yard box.
On the left, we have a player close to the corner taker, which is a short pass option in case he wants to progress the ball. Just outside the penalty are we have another player, but he is tasked with the cleared balls and to be the first line of rest-defence in case of a counter-attack by Atlanta United II. In the six-yard box, we see three players: one at the front post near zone, one at the near central zone, and one at the far central zone. Just outside the box we have three players who as a unit will make a run into that specific six-yard box as the ball is being delivered.
As soon as the corner is taken, we have six players going into the six-yard box, but they don’t go into the same direction. We see a 4-2 formation, with the four players going to the front post near zone – which creates space at the central zones. The two players make use of that space and go into that zone, after which the goal is scored.
LA Galaxy II vs Sacramento Republic FC
In the video above we LA Galaxy II in their game against Sacramento Republic. The corner is taken from the right by a left-footed player, which means the ball will swing in rather than swing out. This also means that the ball is more likely to be delivered in the six-yard box. In the example above we saw players assembled in and around the box, but in this example they stay deep in the penalty area, ready to make runs forward.
On the right, we have a player close to the corner taker, which is a short pass option in case he wants to progress the ball. Just outside the penalty are we have another player, but he is tasked with the cleared balls and to be the first line of rest-defence in case of a counter-attack by Atlanta United II. Just outside the penalty there is another player who is going to make a run into the penalty area. Inside the box there is a unit of four player who are going into the six-yard box as soon as the ball is kicked.
Tha ball swings into the six-yard box and we see that unit of four move to the six-yard box as one horizontal line. They go wide a bit, so each players covers a certain zone of the six-yard box. The player on the edge of the penalty area also makes a run into the box to anticipate a ball coming on the penalty spot.
Hartford Athletic vs New York Red Bulls II
In the video above we see Hartford Athletic in their game against New York Red Bulls II. The corner is taken from the left by a right-footed player, which means the ball will swing in rather than swing out. This also means that the ball is more likely to be delivered in the six-yard box.
On the left, we have a player close to the corner taker, which is a short pass option in case he wants to progress the ball. But in this case he drops deep and doesn’t take part in the routine. Just outside the six-yard bord there is a unit of four player who are going into the six-yard box as soon as the ball is kicked to challenge the four player zonal structure by the opposition.
As soon as the ball is kicked, the unit of four breaks into two separate units of two. The left unit goes to the front post near zone, opening up space in the central zones for the other unit. The other unit moves into that space and tries to attack the ball in the central zones.
Oklahoma City Energy FC vs FC Tulsa
In the video above we see OKC in their game against FC Tulsa. The corner is taken from the left by a right-footed player, which means the ball will swing in rather than swing out. This also means that the ball is more likely to be delivered in the six-yard box.
On the left, we have a player close to the corner taker, which is a short pass option in case he wants to progress the ball. Just outside the penalty are we have another player, but he is tasked with the cleared balls and to be the first line of rest-defence in case of a counter-attack by Atlanta United II. In the six-yard box, we see one player: Just outside the six-yard box, we have three players who as a unit will make a run into that specific six-yard box as the ball is being delivered.
As soon as the ball is kicked we see that unit of three break into a 2-1 formation. The two nearest players go to the near post with the other player going into the far post zone. This is possible because the player in the six-yard box blocks the defender and therefore leaves space to run in the far post zone.