LOƏS OPENDA – DATA SCOUTING

In this scouting piece, I’m going to look at Vitesse’ LoĆÆs Openda. I wanted to have a look at a striker who isn’t at the traditional top-3, but is performing very well. In this piece I’m purely focusing on match data and event data, to make a more data scouting report without the video. I will also relate this to his peers

The data
The data used in this analysis comes from Wyscout. In the dataset for the striker, I’ve selected each player who primarily plays on the striker position. Obviously, there are other players who have played in this position, but I’ve only selected the players that have played as a striker as a dominant position in the current season. This leaves me with 79 players who qualify in the Eredivisie 2021/2022.

Because I’m looking at the current season, which is a full season, I want to make a selection for players that played a decent amount of games for me to assess them. For me, it’s important that they played at least 600 minutes in this season. After looking at that I’m left with 42 players in my dataset and they will go through my analysis process. The data was retrieved on 23rd December 2021.

I will look at the following categories and metrics to assess their abilities through data:

  • Shots
  • Dribbling
  • Assists
  • Goals

Shots

In the scatterplot above you can see the number of shots per 90 of a certain player and the expected goals per 90 of that particular player in question. The reason we look at this is how many shots a player has in a game and how high the probability is of scoring an actual goal.

In the shot volume, we can see that Openda does quite well with 2,48 shots per 90 with an expected goal of 0,46 per game. Those two metrics are both above average as you can see. In the image below you can see Openda’s shot map of the 2021/2022 season with Vitesse so far.

Red = Goals, Grey = Grey

In the image above you can all shots, Openda had in the season so far. In those games, he has scored 10 times, twice from the penalty spot. He had 48 shots and a xG generated of 7,79 from those shots. With 10 goals scored, he’s overperforming with a number of +2,21 – a pretty good result. As you can see 9 goals came from within the penalty area, with only one coming outside of it. The sides are pretty evenly divided when looking at the goals, but in terms of shots, we can say two interesting things: he does shoot from distance more on the right side, but shoots from closer range on the left side.

Dribbling

Dribbling often is linked to wide midfielders of wingers, but it can be a valuable aspect of a striker’s game as well. The ability to control the ball, progress on the pitch, and deal positively with a 1v1 situation with an opponent defender, is not to be underestimated. Especially when you are not playing a typical central forward role, but playing with two strikers.

In the dribbles, we can see that Openda does quite average with 4,15 dribbles per 90 and a success rate of 55,7%. This does actually make him above average, but only just In the image below you can see Openda’s Ball Touch map of the 2021/2022 season with Vitesse so far.

In the image above you see the ball touches map of Openda in the opposition’s half. This is no dribble map, but it does illustrate where Openda gets the ball or touches the ball. In doing so we can see how much he’s closer to the midfield, how much he drops and plays deep – and how much he deviates from the natural striker position into the flanks. What we can conclude is that Openda does occupy the flanks a lot.

Passing

Expected metrics seem simple but can become incredibly complicated when combining things. In the scatterplot above I’ve taken a look at the probability of the pass becoming an assist per 90 minutes and looking at the actual assists of a player per 90 minutes.

In the assists, we can see that Openda does below average with 0,07 xA per 90 and actual assists of 0,06 xA%. As you can see he is performing below average and doesn’t really impress in the data. In the image below you can see Openda’s final third passing map of the 2021/2022 season with Vitesse so far.

In the image above you see all final third passes from Openda in the Eredivisie 2021/2022 – now this doesn’t say a lot about the actual performance, but it does tell us something about the successful passing of Openda. The passes to the penalty area aren’t that successful as you can tell by the red passes, but on the flanks and backward passes are quite successful.

Final thoughts
Data analysis or scouting alone isn’t enough to fully assess the qualities of a player. It should always go hand-in-hand with video and/or real-life eye tests. But it does give us the tools to make shortlists and back up our findings with data. In this case, we can see that Openda does really well in the shooting metrics, but has been on average and below average in the dribbling and assists metrics. Depending on the profile you have for a striker, he could be included or left out. The most important thing to remember is that this never can be seen in isolation but always has to been in relation to something bigger.


SET PIECE ANALYSIS: FC ST. GALLEN’S ATTACKING CORNERSv

Swiss football is truly amazing. It always feel like a bit of an acquired taste or for the more hardcore fans, but it’s truly amazing. In this article I will have a look at St. Gallen playing in the Swiss Superleague. I will focus on their attacking corners.

The attacking corners are so important for teams to make an impact and it can give you a clear chance of scoring if done correctly. In this analysis I will analyse the successful corner routines which resulted in a goal for St. Gallen. The video footage is from Wyscout.

FC St. Gallen vs Basel

In the video above we see St. Gallen in their game against FC Basel. They have a corner from the right and it’s taken by a right-footed player, meaning the ball will swing out away from the goal, rather than swing in towards the goalkeeper. FC Basel employs a two-player zonal structure combined with a single man-marker.

St. Gallen have one player in the six-yard box who is marked. There are two players outside the penalty area who are tasked with making something of the cleared balls but are also tasked with forming the first line of rest-defence in the case of a counter-attack. On the penalty spot, we have one player, and behind that, we have a unit of three players who will make runs into the six-yard box.

As soon as the ball is kicked we see that the player in the six-yard box, as well as the player on the penalty on the spot – move to the near post zone. While one player goes deeper away from the goal, the other remain in that area and is joined by one from the unit. The other go to the goalkeeper zone outside the six-yard box. The ball eventually lands in the near post zone and it’s Youan who scores the goal with his in the near corner.

FC St. Gallen vs FC Zürich

In the video above we see St. Gallen in their game against FC Zürich. They have a corner from the left and it’s taken by a right-footed player, meaning the ball will swing in towards the goal, rather than swing out away from the goalkeeper. FC Zürich employs a two-player zonal structure combined with a single man-marker.

St. Gallen have one player in the six-yard box who is marked. There are two players outside the penalty area who are tasked with making something of the cleared balls, but are also tasked with forming the first line of rest-defence in the case of a counter-attack. On the penalty spot we have a unit of four players who will make runs into the six-yard box and behind them is another player who will make a deep, late run.

As soon as the ball is kicked we see movent in the penalty area. We see two players moving to the near post and one to the far post. This means three players are moving forward in the central areas. The ball is delivered exactly there and due to the runs of the other players, these three have space and time to convert the corner into a goal. In the end, it was DiakitƩ scoring the goal.

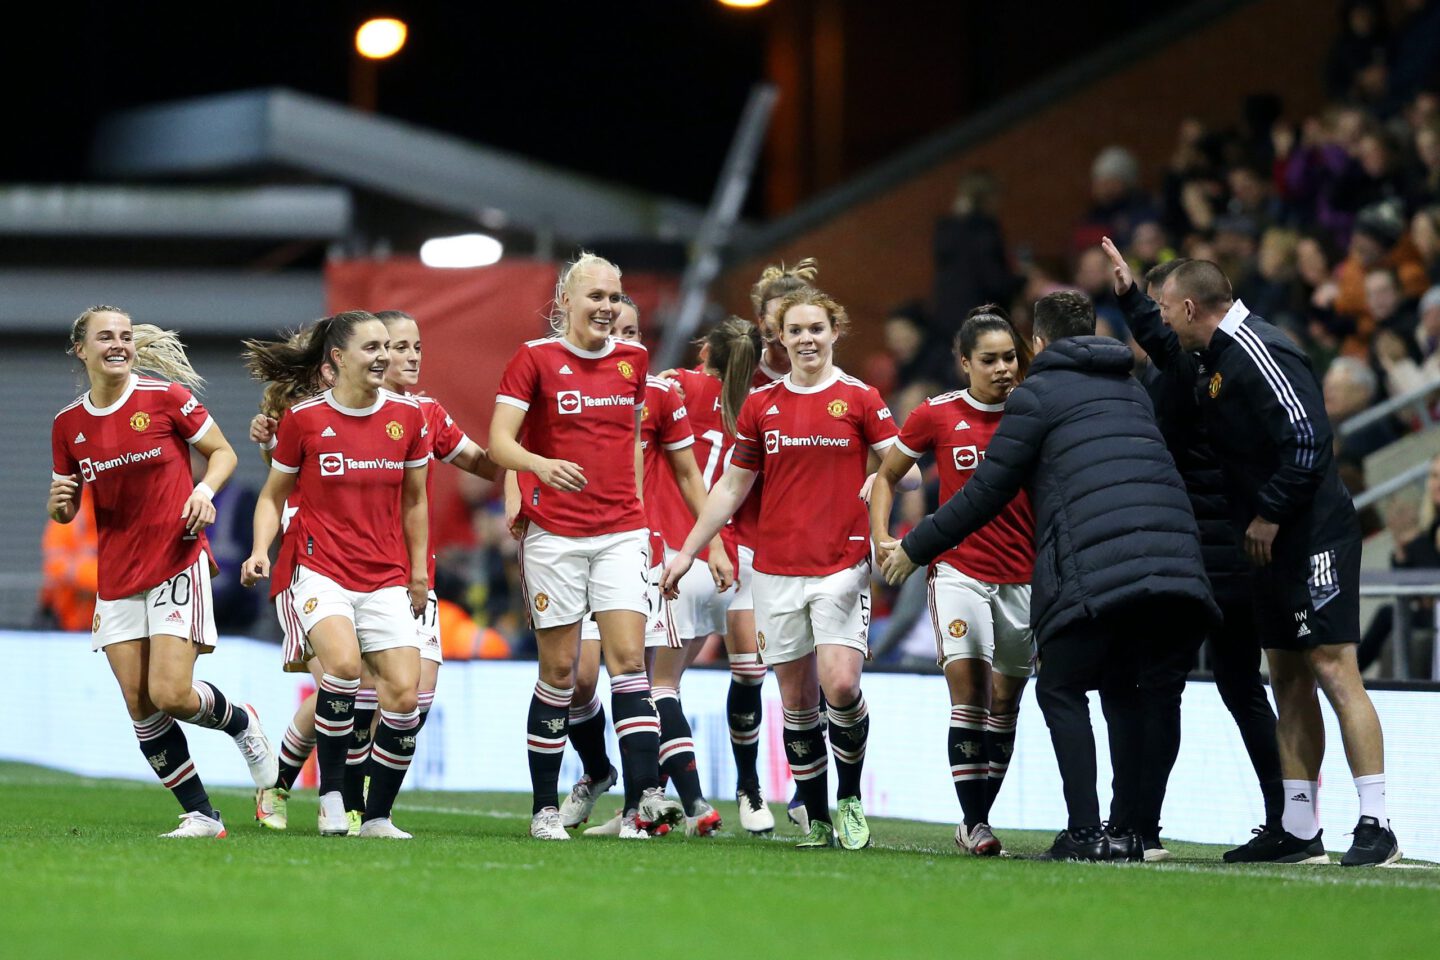
TACTICAL ANALYSIS: ATTACKING STYLE OF PLAY MANCHESTER UNITED WOMEN 2021/2022

As said before, there has been a lot of talk concerning the WSL. It has been a lot about the results of the English sides in the Champions League. But, domestically we see that Manchester United is doing remarkably well, but haven’t gottent the attention as they probably deserve.

In this analysis I will take Manchester United’s performance in the first half of the season and analyse their performances. I will focus on the following things:

  • Formation
  • Build-up & attacking style of play
  • Pressing style

In this analysis I will focus on the WSL 2021/2022. Data and video are from Wyscout.

Formation

According to Wyscout, Manchester United have played in three different formations: the 4-2-3-1 (74%), the 4-4-1-1 (15%) and the 4-3-3 (6%). Now these all have different ideas and principles, but for this analysis I will look at how they set up in the last 5 games, using these formations.

In the image above you see the 4-2-3-1 as employed by Manchester United. What characterises this particular formation is that you work with two specific blocks: a defensive one and an attacking one. The defensive block consists of the four-player defence Blundell-Turner-Mannon-Batille + the low defensive midfield or double pivot of Zelem-Ladd.

The attacking unit does consist of four players. Wide midfielders/wingers Toone and Staniforth with Risa playing on the ’10’ position, behind the striker. The lone striker in this situation is Russo.

In the 4-4-1-1 formation we see a shift in the positioning. There are two lines of four player, meaning that the midfield is strengthened and can play a deep 4-5-1 or 4-4-2 in defence if needed. In this scenario the double pivot is supported by wide midfielders and the difference with the 4-2-3-1 is that they don’t act as much as wingers

The attack is mainly formed by the two strikers up top, although seems like a striker and a shadow striker, the dynamics between the two is of vital importance, and they might shift from positions and roles.

We have no looked at the two main formations which make 89% of the formations used in this particular season. In the next segment we are going to look at how they build up with these formations.

Build up

In this part of the analysis we will look at the build up. With build up is meant the following: how a team progresses from their own goalkeeper or central defenders to the middle third in preparation for the attack.

In the GIF above you Manchester United building up from the back in their game against Everton. The build up start with the central defenders and the goalkeeper passing the ball to each other. There’s a mild press from the Evertonians, but Manchester United want to play out of it and try to circulate the ball in a high tempo. In doing so they have more time and this can be seen on the right flank, as they try to pass the ball to the right back who in this case wins the 1v1 one, inverts and has options in the half space in the middle third.

In the GIF above you see Mancheste rUnited in their game against Brighton and Hove Albion. In this footage we see a different way of buiding up. Manchester United reclaim possession of the ball and start building up with their central defenders. In this case they don’t opt for the direct, shot pass to the full backs – as they are not in the position to do so.

In this game Manchester United employed a 4-2-3-1 sistuation and encouraged full backs to go high, but also needed the double pivot to drop down to cover. The wide midfielders/wingers inverted in order to provide space for the full backs. When this was done, the central defender could play the long ball to the right flank, where the right full back made a run down the line in order to continue the attack.

In the GIF above you see Manchester United in their game against Leicester City. We see the central defenders on the ball and playing out from the back. Instead of doing that what has been done against Brighton, Manchester United did something slightly different.

The full backs did progress higher into the middle third, but not as high as in a different scenario. They stay a bit more conservative giving space to the wide midfielders/wingers to go wide. They do not invert, but go as wide as possible. The wide midfielders/wingers drop down as well to be able to receive the ball and that’s what happens here – and they will carry the ball into the final third.

Attacking style of play

Manchester United does create chances via their build up, as we have seen in the examples above, but in this egment of the article we are going to focus on the attacking style of play that involves their pressing. In the attacking third they press aggressively and that leads to possession in dangerous areas of the pitch for the opposition, which makes them a threat in those areas of the pitch.

In the examples below I will illustrate how they create goalscoring opportunities through their pressing.

In the GIF above you see Manchester United against Aston Villa. Aston Villa try to play it out from the back, but due to the agressive pressing from united on the full back an dthe defensive midfielder, they are able to regain possession of the ball in the central zones of the pitch and get the ball into zone 14, where Manchester United do shot on target. In this instance they could have carried it more into the penalty are, but they had space and time to hurt Aston Villa.

In the GIF above, you can see Manchester United in their game against Everton. The pressing starts with the striker who forces the goalkeeper/central defender to play it long to the middle third. When the ball is in the middle third, the defenders press the receiving player and hope to get possession of the ball again, after which the transition is done with great pace towards the left flank. The cross from that flank isn’t optimal, but does get to the striker who can get a shot on goal. In just a few passes, Manchester United is direct and gets in the right positions to harm the opposition.

Goals scored

So how do we go from creating a goalscoring opportunity to an actual goal? In the examples below you can see how Manchester United did that in their last few games.

In the video above you see Manchester United in their game against Aston Villa, as they used their pressing to get the ball in dangerous areas. They make use of 2 players pressing the player on the ball and used that twice, which ultimately ended up in getting the ball in the penalty area. A good move from the Manchester United player and a brilliant finish to top it off.

In the video above we see Manchester United in their game against Everton, while they have the ball in the middle third to start with. This attack is not the result of pressing, but does show us how many numbers Manchester United want to have getting forward. The ball goes to the wide midfielder who moves into the half space leaving space on the right flank. The right full back makes a run down the line, and is open to receive the ball when the wide midfielder passes the ball to the middle. Even though the central areas are loaded, Manchester United keep the ball and manage to find the the combination with a run, splitting Everton’s defence open and score a good goal.

In the video above we see Manchester United in their game against Brighton. They are in the attacking third and while Brighton applies a good press on the Manchester United players, they are managing to get out of it due to their technical abilities. High ball retention, technical ability and pace – meant that Manchester United was one step ahead and the ball went to the right flank, after which the cross was provided into the six-yard box. A smart finish guided the ball into the far corner, a good goal for Manchester United

Final thoughts

In this article I’ve highlighted some elements of Manchester United’s direct approach to attacks. They make sure to press high and get the ball to have goalscoring opportunities from there. They also know how to use their build up to swithc from the calm passes in the defensive third, to the high speed, direct play in the attacking third. This approach has been quite successful in the last few games and it’s interesting to see where it leads them, come end of the season.

DATA SCOUTING DAMALLSVENSKAN: FINDING THE BEST STRIKER

There has been a lot of controversy in women’s football in the last few days. What is the best league and which league is better than the other? Bit of non-discussion in my opinion, but the most important thing in it all is the accessibility and visibility of the league. I think that the Swedish Damallsvenskan is a league which relatively good and produces strong talents, but due to visibility isn’t really hyped. That’s why I’m writing about it today.

In this scouting piece I’m going to look for a striker who’s good in the box, has volume in shots per 90 and looks to match or overperform his expected goals ratio.

The data
The data used in this analysis comes from Wyscout. In the dataset for the striker, I’ve selected each player who primarily plays on the striker position. Obviously, there are other players who have played in this position, but I’ve only selected the players that have played as a striker as a dominant position in the current season. This leaves me with 71 players who qualify in the Damallsvenskan 2021.

Because I’m looking at the current season, which is a full season, I want to make a selection for players that played a decent amount of games for me to assess them. For me, it’s important that they played at least 600 minutes in this season. After looking at that I’m left with 38 players in my dataset and they will go through my analysis process. The data was retrieved on 18th December 2021.

I will look at the following categories and metrics to assess their abilities through data:

  • Shots
  • Dribbling
  • Offensive duels
  • Assists
  • Goals

After going through the data analysis and visualisation, I will make a shortlist of players who I think are worth keeping your eye on.

Shots
Looking at shot quality can be measured in different things. In the scatterplots below I will look at the volume of the shots and the expected goals that are generated through the shots.

In the shot volume, we can see that Blackstenius 4,82 shots per 90), Gielnik (3,99 shots per 90), and M. Larsson (3,89 shots per 90) stand out in terms of the number of shots.

The best performers in terms of the percentage of shots going on target are Jakobsson with 61,54% shots on target, Rogic with 60% shots on target, and M. Larsson with 54,35% shots on target.

In the scatterplot above you can see the number of shots per 90 of a certain player and the expected goals per 90 of that particular player in question. The reason we look at this is how many shots a player has in a game and how high the probability is of scoring an actual goal.

In the shot volume, we can see that Blackstenius 4,82 shots per 90), Gielnik (3,99 shots per 90), and M. Larsson (3,89 shots per 90) stand out in terms of the number of shots.

Looking at the expected goals generated per game we see the following players coming on top: Blackstenius with 0,81 xG per 90, M. Larsson with 0,8 xG per 90, and Lundin with 0,52 xG per 90.

Dribbling

Dribbling often is linked to wide midfielders of wingers, but it can be a valuable aspect of a striker’s game as well. The ability to control the ball, progress on the pitch, and deal positively with a 1v1 situation with an opponent defender, is not to be underestimated. Especially when you are not playing a typical central forward role, but playing with two strikers.

If we look at the number of dribbles per 90, the following players come out on top of their respect metric: Jónsdóttir with 8,78 dribbles per 90, Kafaji with 8,34 dribbles per 90, and EirĆ­ksdóttir with 8,12 dribbles per 90.

When we look closer to the success rate of the dribbles, we can see that a different set of players scores high – but attempt fewer dribbles per 90: Zamora with 67,5% successful dribbles, Scarpa with 65,38% successful dribbles, and Wangerheim with 65,12% successful dribbles.

Offensive duels

The importance of offensive duels can be seen in two lights. The first one, is to measure the physicality of a strikers and the ability to win offensive duels to create something out of an attack. The second one, is to engage in the pressing style set out by a team. The ability to press a direct opponent and win the ball can also be found in this metric of offensive duels.

The most offensive duels conducted per 90 are by the following players: Da Silva with 19,52 offensive duels per 90, Mijatovic with 19 offensive duels per 90, and EirĆ­ksdóttir with 18,77 offensive duels per 90.

If we look closer at the players that have the highest percentage of won offensive duels, the following players stand out: Hellstrom with 39,52% offensive duels won, Gielnik with 39,17% offensive duels won, and Mijatovic with 39,09% offensive duels won.

Assists

Expected metrics seem simple but can become incredibly complicated when combining things. In the scatterplot above I’ve taken a look at the probability of the pass becoming an assist per 90 minutes and looking at the actual assists of a player per 90 minutes.

If we look at the expected assists per 90, we can see that three players stand out from the crowd with a significantly higher xA per 90 than the rest. Jónsdóttir has 0,26 expected assists per 90, Jalkerud has 0,25 expected assists per 90, and M. Larsson/Mijatovic has 0,24 expected assists per 90.

Looking more closely, we can see that the actual assists per 90 don’t correspond with the three players with the highest expected assists per 90. Bredgaard has 0,33 assists per 90, Kapocs has 0,30 assists per 90, and Jalkerud/Mijatovic has 0,29 assists per 90.

Goals

In the end the most important thing for a striker is his output: goals. I’m looking at the probability of scoring a goal with a certain short and looking at the actual goals scored by a particular player per 90 minutes.

Looking at the expected goals generated per game we see the following players coming on top: Blackstenius with 0,81 xG per 90, M. Larsson with 0,8 xG per 90, and Lundin with 0,52 xG per 90.

When we look more closely to the actual goals scored per 90 we see that Blackstenius stands out with 0,80 goals per 90, followed by Kanu with 0,7 goals per 90,  and M. Larsson with 0,59 goals per 90.

Short list

Four players have impressed me in terms of data and I have made percentile ranks data visualisations of them, before going further and analysing them through video.

After this phase of data scouting and analysing, we will move into video scouting and assess how well they do in certain game situations. This article was an example of how you use data to make a shortlist.

SET PIECE ANALYSIS: SPORTING CLUBE DE PORTUGAL ATTACKING CORNERS

It’s day 13 of blogmas already with this time’s attention for the Primeira Liga in Portugal. In this article, I will focus on attacking corners done by Sporting Clube de Portugal, as they are the most successful with scoring from corners. Currently, they have scored 5 goals from attacking corners.

In this analysis, I will analyse 3 different successful corners, look at their routines and explain why these were so successful in the league. The video footage is from Wyscout and has been retrieved on December 13th 2021.

Sporting CP vs FC PaƧos de Ferreira

In the video above we see Sporting CP in their game against PaƧos de Ferreira. They have a corner from the left and it’s taken by a left-footed player, meaning the ball will swing out away from the goal, rather than swing in towards the goalkeeper. PaƧos de Ferreira employs a five-player zonal structure, meaning that Sporting CP will predominantly use late runners to disturb their zonal structure.

There is one player in the six-yard box, in the far post zone, and man-marked by PaƧos de Ferreira. We then see three different units: two players in the near post zone, two players on the penalty spot and one in the far post zone, together with that other player. Outside the penalty area, we see two players who are tasked with cleared balls but also do function as the first line of rest defence in the case of a counter-attack.

As soon as the ball is played we see movement in those players, four players move into the near post zone, while one player goes to the goalkeeper zone. The player in the goalkeeper zone has the space to head the ball and guides it to the near post again. After which it is converted into a goal by one of those four players standing at the near post. The pace of the attacking side is higher and therefore they surprise PaƧos de Ferreira.

Sporting CP vs Vitória SC

In the video above we see Sporting CP in their game against Vitória SC. They have a corner from the left and it’s taken by a left-footed player, meaning the ball will swing out away from the goal, rather than swing in towards the goalkeeper. Vitória SC employs a six-player zonal structure, meaning that Sporting CP will predominantly use late runners to disturb their zonal structure.

There is one player in the six-yard box, in the near post zone, and man-marked by Vitória. We then see two different units. We see two players making their way into the near post zone and we see three players who are making late runs into the six-yard box too. Outside the penalty area, we see one player concerned with the cleared balls and/or rest defence.

Those three deep, late runners are of vital importance to the success of this corner routine. These three players have the greatest distance to cover and they can go into that six-yard box because these runs are effective against a zonal structure and all three of them have space. In the end it’s a good header that scores the goal for Sporting CP.

Sporting CP vs FC Famalicão

In the video above we see Sporting CP in their game against FamalicĆ£o. They have a corner from the right and it’s taken by a right-footed player, meaning the ball will swing out away from the goal, rather than swing in towards the goalkeeper. FamalicĆ£o employs a five-player zonal structure, meaning that Sporting CP will predominantly use late runners to disturb their zonal structure.

There is one player just outside the six-yard box, and will make his move into it. Then we have two players in the near post zone and two players on the penalty spot. There is also one player in the deep far post zone, who is in the penalty area. He is available for a shot, but will also deal with cleared balls.

As soon as the ball is kicked we see that the ball is going to the near post zone and one of the two players that were on the penalty spot makes a run to that zone and connects with it. The ball is guided to the area between the far post zone and the goalkeeper zone – the other player who starts at the penalty spot has space and time to finish the ball: goal for Sporting CP.

DATA SCOUTING DUTCH TWEEDE DIVISIE (3RD TIER): FINDING A STRIKER

Day 11 of Blogmas and this time I’m going to cover the Dutch 3rd tier. I was very excited that I could find data on this league on Wyscout, because it is an amateur competition within a closed system, but on that latter part, I will write a different article.

In this article, however, I will use data to scout the best strikers in the Tweede Divisie and make a shortlist of which players are worth following in the next months to come.

The data
The data used in this analysis comes from Wyscout. In the dataset for the striker, I’ve selected each player who primarily plays on the striker position. Obviously, there are other players who have played in this position, but I’ve only selected the players that have played as a striker as a dominant position in the current season. This leaves me with 75 players who qualify in the Eliteserien 2021.

Because I’m looking at the current season, which is a full season, I want to make a selection for players that played a decent amount of games for me to assess them. For me, it’s important that they played at least 600 minutes in this season. After looking at that I’m left with 23 players in my dataset and they will go through my analysis process. The data was retrieved on 18th September 2021.

I will look at the following categories and metrics to assess their abilities through data:

  • Shots
  • Dribbling
  • Offensive duels
  • Assists
  • Goals

After going through the data analysis and visualisation, I will make a shortlist of players who I think are worth keeping your eye on.

Shots
Looking at shot quality can be measured in different things. In the scatterplots below I will look at the volume of the shots and the expected goals that are generated through the shots.

In the shot volume, we can see that Castien (4,69 shots per 90), Van der Moot (3,59 shots per 90), and Brandsma (3,33 shots per 90) stand out in terms of the number of shots.

The best performers in terms of the percentage of shots going on target are Sanchez with 80% shots on target, Bitter with 80% shots on target, and Brandsma with 60% shots on target.

In the scatterplot above you can see the number of shots per 90 of a certain player and the expected goals per 90 of that particular player in question. The reason we look at this is how many shots a player has in a game and how high the probability is of scoring an actual goal.

In the shot volume, we can see that Castien (4,69 shots per 90), Van der Moot (3,59 shots per 90), and Brandsma (3,33 shots per 90) stand out in terms of the number of shots.

Looking at the expected goals generated per game we see the following players coming on top: Van der Linden with 0,77 xG per 90, El Azzouti with 0,64 xG per 90, and Blommestijn with 0,59 xG per 90.

Dribbling

Dribbling often is linked to wide midfielders of wingers, but it can be a valuable aspect of a striker’s game as well. The ability to control the ball, progress on the pitch, and deal positively with a 1v1 situation with an opponent defender, is not to be underestimated. Especially when you are not playing a typical central forward role, but playing with two strikers.

If we look at the number of dribbles per 90, the following players come out on top of their respect metric: Hardijk with 10,18 dribbles per 90, Admiraal with 7,82 dribbles per 90, and Sterling with 7,36 dribbles per 90.

When we look closer to the success rate of the dribbles, we can see that a different set of players scores high – but attempt fewer dribbles per 90: Poepon with 58,52% successful dribbles, Zeldenrust with 57,58% successful dribbles, and Bitter with 56% successful dribbles.

Offensive duels

The importance of offensive duels can be seen in two lights. The first one, is to measure the physicality of a strikers and the ability to win offensive duels to create something out of an attack. The second one, is to engage in the pressing style set out by a team. The ability to press a direct opponent and win the ball can also be found in this metric of offensive duels.

The most offensive duels conducted per 90 are by the following players: Sterling with 16,47 offensive duels per 90, Hardijk with 16,12 offensive duels per 90, and Castien with 15,26 offensive duels per 90.

If we look closer at the players that have the highest percentage of won offensive duels, the following players stand out: Blij with 45,61% offensive duels won, Langedijk with 45% offensive duels won, and Sterling with 43,48% offensive duels won.

Assists

Expected metrics seem simple but can become incredibly complicated when combining things. In the scatterplot above I’ve taken a look at the probability of the pass becoming an assist per 90 minutes and looking at the actual assists of a player per 90 minutes.

If we look at the expected assists per 90, we can see that four players stand out from the crowd with a significantly higher xA per 90 than the rest. Vink has 0,39 expected assists per 90, Kaptein has 0,41 expected assists per 90, and Castien has 0,32 expected assists per 90.

Looking more closely, we can see that the actual assists per 90 don’t correspond with the three players with the highest expected assists per 90. Vink has 0,74 assists per 90, Doesborg has 0.39 assists per 90, and Wouter/Zeldenrust has 0,38 assists per 90.

Goals

In the end the most important thing for a striker is his output: goals. I’m looking at the probability of scoring a goal with a certain short and looking at the actual goals scored by a particular player per 90 minutes.

Looking at the expected goals generated per game we see the following players coming on top: Van der Linden with 0,77 xG per 90, El Azzouti with 0,64 xG per 90, and Blommestijn with 0,59 xG per 90.

When we look more closely to the actual goals scored per 90 we see that Van der Linden stands out with 0,99 goals per 90, followed by Blommestijn with 0,94 goals per 90,  and El Azzouti with 0,78 goals per 90.

Short list

Four players have impressed me in terms of data and I have made percentile ranks data visualisations of them, before going further and analysing them through video.

After this phase of data scouting and analysing, we will move into video scouting and assess how well they do in certain game situations. This article was an example of how you use data to make a shortlist.

SET PIECE ANALYSIS: HUDDERSFIELD TOWN ATTACKING CORNERS

It’s day 9 of blogmas already with this time attention for the Championship in England. In this article I will focus on attacking corners done by Huddersfield Town, as they are the most successful with scoring from corners. Currently they have scored 7 goals from attacking corners.

In this analysis, I will analyse 3 different successful corners, look at their routines and explain why these were so successful in the league. The video footage is from Wyscout and has been retrieved at December 9th 2021.

Huddersfield Town vs Peterborough

In the video above we see Huddersfield Town in their game against Peterborough United. They have a corner from the left and it’s taken by a right-footed player, meaning the ball will swing in towards the goal, rather than away from the goalkeeper. Peterborough United employs a two-player zonal structure, meaning that Huddersfield Town will have more opposition in the second line of the set up.

There is one player in the six-yard box, pinned against the goalkeeper and man-marked by Peterborough. We then see a unit of runners, posing as a train. These are five players who will go forward into the six-yard box as soon as the ball is played.

When the ball is played we see movement. The unit breaks up as the ball is played with two runners going to the near post zone, two players going into the goalkeeper zone and one player going to the far post zone. The ball is header from the far post zone into the goalkeeper zone, where Ward connects with the ball and scores the goal.

Huddersfield Town vs Blackpool

In the video above we see Huddersfield Town in their game against Blackpool. They have a corner from the right and it’s taken by a left-footed player, meaning the ball will swing in towards the goal, rather than away from the goalkeeper. Blackpool employs a four-player zonal structure, meaning that Huddersfield Town will likely make runs into the six-yard and be dangerous.

There is one player in the six-yard box, pinned against the goalkeeper, but isn’t man-marked. There is one player for the short corner option on the right and we have a unit of runners to the left, beginning at the far post zone. Again, this a unit of five players. On the edge of the penalty area there is another player who is tasked dealing with cleared balls and is the first line of rest defence in the evens of a counter-attack.

As soon as the ball is kicked we see that the player for the short corner option sprints to the edge of the penalty area. At the same time we see those five runners making their way into the six-yard box: goalkeeper zone and far post zone. These runs will have more effect, because there is a zonal marking scheme. In the end, the ball goes to the goalkeeper zone and because of the runs and movement, the player closest to the keeper can head the ball in and score a goal.

Huddersfield Town vs Fulham

In the video above we see Huddersfield Town in their game against Fulham. They have a corner from the right and it’s taken by a right-footed player, meaning the ball will swing out away from the goal, rather than towards the goalkeeper. Fulham employs a two-player zonal structure, meaning that Huddersfield Town will have to be creative in their runs.

There is one player in the six-yard box, pinned against the goalkeeper, and is man-marked. There are two players standing outside the penalty area who are tasked with dealing with cleared balls and are the first line of rest defence in case there is a counter-attack. There is a unit of five who will try to make runs in the six-yard box, but they are guarded by blockers, making it a 5v5 in the deep zone.

As soon as the ball is kicked we see movement going on. The unit of five splits in one unit of four + a player making a different run. The four players move towards the goalkeeper zone, while the other player moves into the near post zone. By moving in different directions and making runs against the zonal structure, they create space for themselves in the six-yard box, which Pearson utilises and scores a goal.

BORUSSIA DORTMUND II: ATTACKING THIRD PRESSING IN MINUTES 0-15

It’s safe to say that I’m a big fan of 3. Liga. There is something spectacular about that league that has so many important outcomes. Relegation to Regionalliga means a lot to clubs in a negative way, but promotion to the 2. Bundesliga is a great step up and makes the dream of playing in the 1. Bundesliga feasible.

In this article, I will look at Borussia Dortmund II. This second team is allowed to play in the 3. Liga, but is not allowed to be promoted. But there is enough incentive to get better and learn, as they are progressing the talents and making them ready for the first team.

Today I’m looking at the pressing from Borussia Dortmund II and I wanted to focus on the attack third pressing – pressing the goalkeeper and central defenders. I’ve taken the decision to this in the first 15 minutes of the game, as many 3. Liga teams are known for pressing their opponents early on and getting quick goals.

In the image above you can see the pressing done by Borussia Dortmund II in the 2021/2022 season so far. In this pitch provided by InStat you can see how they are set up: by third. If we look at the numbers of pressing, the defensive third has the least, followed by the middle third and the attacking third the most – which is quite local. In the time fram we are looking (0-15 minutes) Dortmund has pressed 35 times.

As you can see the pressing has been done in the middle but also on the flanks. For the purpose of this article I want to look at the pressing done at the goalkeeper and central defenders. You can see that in the image below.

As opposed to the pitch above, you see a pitch with 18 different zones. Now every zone can illustrate something really interesting, but again I want to focus on the attacking third, especially the middle zone with 14 in it. This 14 means that there were 14 pressing moments in the first 15 minutes of the games so far in this season.

Before I’m going to how Dortmund pressed, I wanted to explain why it’s relevant to look at this element of their game. If we want to see whether a team is aggressive and wants to recover the ball high up the pitch to create goalscoring opportunities from those areas, we can measure it by looking at the press. How do they do it? Where do they do it? I have 3 different examples where Dortmund do exactly that.

In the video above you Dortmund II in their game against Viktoria Berlin. The opposition has the ball and we see that Dortmund II is lined up with two inverted wingers/double #10 higher than the actual striker. At the moment that the goalkeeper passes the ball to one of his central defenders, the pressing has been triggered and the striker will press the player on the ball. Depending on which side the central defenders has his vision, that particular winger will press that flank as well. The striker presses aggressively while the wingers will only press intensely when the ball is going their way. The idea behind pressing in this example is to force the defender to give a long ball forward – in order to win the aerial duel and construct an attack themselves.

In the video above you Dortmund II in their game against VfL Osnabrück. You see 3 player in that 2-1 formation going forward. As soon as the ball is played from the central defender to the right full back, two players press as a unit towards the central defender and full back, with the #10 also following to block passing lanes or preventing the defensive midfielder getting the ball. In doing so they force the defence to play it long towards the middle third, or towards the goalkeeper – who will be pressed by one of the player from that two-man unit, making it uncomfortable for the goalkeeper.

In the video above we see Dortmund II in their game against Kaiserslautern. The attack ended at the right flank after which Kaiserslautern had the ball. They choose to resume play via the other flank to build, because there is space. When the defenders have the ball on the right flank, the pressing scheme is different, because the position of pressing is optimal. Instead of pressing organised or with 2 players, Dortmund II opt to only use the striker who needs to be aggressive in his pressing. This will mean that if it’s successful, the full back will play the ball back to the central defenders/goalkeeper or kick it long to the middle third.

Final third

In the first 15 minutes, everyone is fresh and steady. They want to make a mark and we have seen in the videos above how Dortmund II press the central defenders and the goalkeeper, by using different forms of intensity: a high pace, aggressive press by the striker and a structured press by the inverted wingers/double #10s in a unit. The press will be different later on in the game and subject to tactical changes, but Dortmund II set out to make a mark via this kind of pressing in the first 15 minutes.

BARCELONA B 2021/2022: CHANCE CREATION FROM ZONE 14

I never thought I would write about Barcelona to be honest. So many people before have written about this club, but I thought that writing about their ā€˜B’ team would be quite interesting as they aren’t operating in a top 5 league, and it’s always good to see whether talents do well in a league that is full of senior players.

I will look more closely to how Barcelona B creates chances from zone 14 and I’m doing that by looking at video fragments of those chances in the 2021/2022 season in the Segunda Division B in Spain.

Zone 14

What is zone 14 and why is it important to many analysts? Spielverlagerung does explain it rather nicely:

ā€œOn a pitch divided into a six-by-three grid with a central strip as wide as the six yard box, the Zone 14, also called The Hole, has been classified as the rectangle which helps teams score more goals. Zone 14 is the zone located in the middle of the pitch immediately outside the opposing penalty area. During the 1990s and early 2000s, statistical data showed that successful teams such as the World Cup winning team of France or 1999 Champions League winner Manchester United had a better performance in Zone 14, as it was the key area which produced vast majority of passing assist. Until today, some prefer the concept of using Zone 14 as a target area in terms of build-up play, mostly denying the use of cross passes. According to various studies, the most effective way to use Zone 14 is to play a pass into the penalty area. Plus, the phase of possession in Zone 14 should not take longer than eight seconds.ā€

I like to look at zone 14 when I analyse teams. Not so much because I value zone 14 a lot, but I find it interesting to see which teams use that zone a lot and try to create goalscoring opportunities from there.

Chance creation: shooting

In the image above you see the pitch divided into 14 zones, which has been generated from InStat. In the current season, Barcelona B has created 82 chances, all of them in the final third. AS you can see chances have been created on the flanks, a stagger 71 chances within the penalty area and 7 have been created in that zone 14, we spoke about above. 8,54% of the chances were created from zone 14 and that’s what we are analysing in the next segment.

In the 3 videos above you can see how Barcelona B does shoot from zone 14. They often come in the situations by pressing the defenders, making sure that timing and place of the pressing is accurate, and regainin possession of the ball. In doing so they have 2-3 players in and around zone 14, which makes it easier to shoot from these locations. As you can see in the 3 videos above, the Barcelona outfit is quite successful when doing so in zone 14.

Zone 14 chance creation: passing

In the image above you can see the passes to the penalty area by Barcelona B per zone – this is a 14 zone grid. We see that the most passes come from the flanks, with 129 passes coming from the left and 102 passes from the right. As I’ve stated, I’m only interested in the zone 14 passes. In total there are 364 passes into the penalty area with 30 coming from zone 14, which is a percentage of 8,24%. Which is almost the same as the percentage for shots from zone 14.

What Barcelona B does very well in passing to the penalty area from zone 14 are two things. The first thing is that they want to dominate control of the ball in zone 14. They keep it in possession and try to play short passes within that zone to maintain control of the ball. The second thing they do well is that they try to look for that through ball or key pass that sets the attacking players up for a 1v1 or a good angle to shoot from. This isn’t always successful, but the intention is there and that’s why zone 14 can be very helpful in creating goalscoring opportunities.

Final thoughts

The main reason for creating this rather short article is to look at how Barcelona B does in zone 14 with chance creation. This is a very descriptive and quite obvious article, but it can also help in getting links. How do you use event data in combination with videos to analyse certain patterns of play? How do you contextualise and visualise chance creation?

SIMON ADINGRA: DRIBBLE & SHOT ANALYSIS 2021/2022

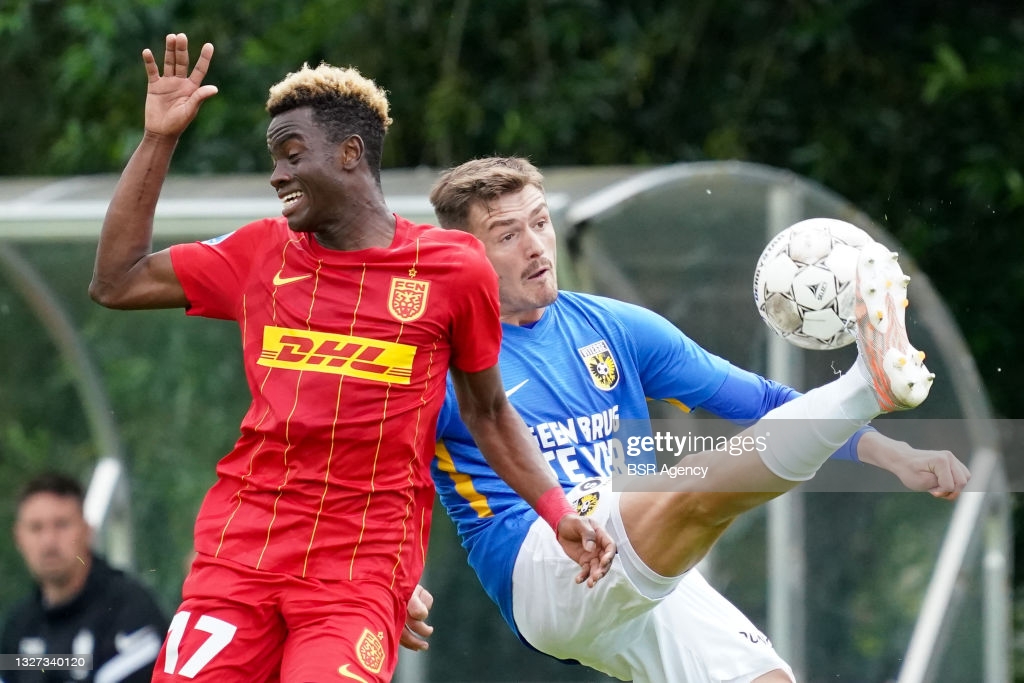
Today is the time for me to delve into a player playing in Denmark. There is a variety of talent in Denmark and I hadn’t taken a good look on my website at this league or the talents in it. I’m having a looking at this article at NordsjƦllands’s Simon Adringra (19 years), focusing on his dribbles and shots.

In this analysis, I will zoom in on his attacking decisive actions during the 2021/2022 Danish Superliga in Denmark with the focus on dribbles and shooting stats from Wyscout/InStat data and then concentrating on some video fragments from Wyscout as well. In my dataset, I’ve chosen for all players playing on the striker position and have played over 600 minutes in the Superliga season. This leaves me with 26 players in my dataset to further go into the data analysis. I’m aware of the fact that often drifts to the left, but I wanted to analyse him in comparison to other strikers as he has played there a lot too.

Dribbles

In the image above you can see two metrics combined in a scatterplot. We look at the dribbles per 90 and the successful dribbles in percentages to look at two things. How many dribbles per 90 have been conducted per 90, and how high is the percentage of success at a particular player.

When we look at Adingra we can conclude that he has 9,92 dribbles per 90, which is above the average among strikers of 4,06. When we look at the percentage of dribbles that are successful we see that Adingra has a success rate of 50,91% which is just above the average of 43,94%.

I want to know where his dribbles have occurred during the season. I’m not as interested in the carries and where he finished the dribbling, but from which positions he started the dribbles. In the image below I’ve looked at the starting position of all dribbles he has attempted during the season.

As described above, you can see all the starting locations of the 98 dribbles Adingra had in the season. Of those 78 dribbles, 50,91% were successful, that’s roughly 50 dribbles that are successful. He has the most dribbles on the left side, with a fair number of dribbles starting in the middle third, but most of them in the attacking third. Further, we can assess that a lot of his dribbles start on the left of which we will give two examples below.

In the two videos above in the game against Midtjylland and Silkeborg, you see Adingra making a dribble with the starting location on the left. He then proceeds to make a 1v1 action and invert in order to find a shooting opportunity for himself or to find teammates who are having a better chance of creating something or having a go on goal themselves.

Shooting

I’ve added the metrics above to the profile to assess Adingra, because he has been instrumental in being a threat in front of goal. That’s why I’m looking at his numbers in shots per 90 and how many threat does shot pose – what is the probability of a shot being converted into a goal. This can be measured with the expected goals per 90 metric.

Adingra does quite well in these metrics as you can see in his position in the scatterplot. He has 3,34 shots per 90 and 0,29 expected goals per 90.

In the beeswarmplot above, you can see 6 metrics to assess a striker. It tells us how good Adingra is compared to his peers in each of these metrics. He performs quite well overall, but in the Non-penalty goals per 90, goal conversion and xG per 90 – he does very well.

The shootings stats in themselves show us the number of shots or type of shots or anything data related to the shots. Adingra does very well in those terms, but in the next part of the analysis, we want to look at where the shots actually came from and what that does tell about the position Adingra attempts to score a goal. Does he generate his xG from a few big chances? Or does he accumulate his xG by shooting a lot of low probable chances?

In the image below, we can see all of Adingra’s shots taken in the Superliga 2020/2021 season. There are 37 shots of which 5 have gone in goal which is a conversation rate of 13,51%. The image shows us the shot locations of the last 37 shots during the season and I will attempt to analyse which are most frequent.

Simon Adingra has scored 5 goals in the Superliga 2021-2022 season so far and had 37 shots in total. That is a goal conversion rate of 13,51%. From those 37 shots, 48,6% went on target. In the visual above you can see the shot locations of every shot attempted in the current season. In red, you see the goals and in grey the shots.

What we can conclude from this visual is that all of the goals are scored within the penalty area on the right side. We do see that he often attempts from the left side but isnt successful from that flank.

In the videos below I will have a look at the five goals scored by Adingra, showing how he preys on mistakes made by the opposition and will punish them.

In the video above you see how NordsjƦlland has a counter attack but only Adingra is up top. His pace and the space to chase the last defender, gives him an advantage and he wins the ball. After he has done that he sets himself up nicely and shoots the ball calmly past the goalkeeper.

In the video above we see NordsjƦlland in a smiliar situation from the first video, as we see them starting a counter attack. This time the ball isn’t directly played to Adingra, but he makes a third man run, which proves worthy in the end. He gets the ball in the central zones and has time to finish in the penalty area. He scored at the near post.

In this game from NordsjƦlland we see that the opposition doesn’t deal with a high ball from NordsjƦlland. Miscommunication between the central defenders and the goalkeeper, means that Adingra can profit from the error and he does this successfuly, scoring another goal after an error.

A very similar situation to the previous goal. He manages to stay close to the central defender and scan the space between the two central defenders. In doing so he manages to get to the ball quickly when the error comes and ultimately has a good finish which beats the goalkeeper: goal.

In the video above we NordsjƦlland in possession of the ball when they begin their attack. The long ball from the keeper is recovered by the opposition but they are not aware of how high NordsjƦlland’s attackers are. Again Adingra, makes the most of the error and has an opportunity to score – and does this brilliantly.

Final thoughts

NordsjƦlland always has very interesting prospects and the talent is undeniable. In the case of Adingra I wanted to see how this attacker managed to use the space with dribbling and how his end product is. I think there is a huge talent to seen in this footballer, but he needs to work on efficiency of his actions. He often gets caught in wanting too much with his dribbles or his end product lacks the comfort of scoring goals. Yes he does score goals after errors, but he finds himself in situations where he might score more. Even though he is outperforming his xG of 3,27 and 5 goals – but this can be even better for the young attacker.