Differences in shooting styles across Regionalliga — Germany’s 4th tier

“Data does tell facts and therefore always is the truth” — how often I’ve heard this, I can’t even count the number. I think this is such a weird way of looking at data, as data is a construct so if anything, it’s always subjective and prone to bias. One of the cases is how you deal with match-level generic data provided by data providers.

Read more: Differences in shooting styles across Regionalliga — Germany’s 4th tier

Within Wyscout you have a scala of different leagues that are provided with data. And, in general, I think that’s really great to have such coverage over different leagues all over the world. Now, what I have noticed is that these leagues are often categorised in terms of tiers. For example, you have Serie C in Italy (3rd tier), National League North/South in England (5th tier) and Regionalliga in Germany (4th tier) — which are all covered in the data within the same dataset, despite having different leagues. That’s why I’m going to look a little deeper into the data for the Regionalliga.

The idea is to see how shots are conducted in the different subdivisions of this tier. Not every league has the same style of play, which will also be reflected in the data — without making the distinction, the data is effectively skewed.

The leagues

There are 5 different leagues within the 4th tier we call the Regionalliga:

  • Regionalliga Nord
  • Regionalliga Nordost
  • Regionalliga West
  • Regionalliga SĂźdwest
  • Regionalliga Bayern

The first thing we will need to clarify is that we need access to all data to make something work and that our conclusion from this article needs to concise as possible. So, here we encounter the first problem: only 4/5 leagues are completely accessible in terms of data. Regionalliga Nordost has two teams available in terms of data, so we have to exclude them from what we are trying to achieve here.

That still leaves us with approximately 2000 players across four leagues that will make up the style of each division.

Method

In the method, we look at how I will gain results. The aim is to look at how the different leagues have similarities/differences. I want to look at two different things:

  1. The volume of shots per league by looking at the total shots.
  2. Expected goals per 90 and looking at the differences between the leagues.

I will use the Wyscout data and analyse these metrics, after which I will try to visualise it.

Shots

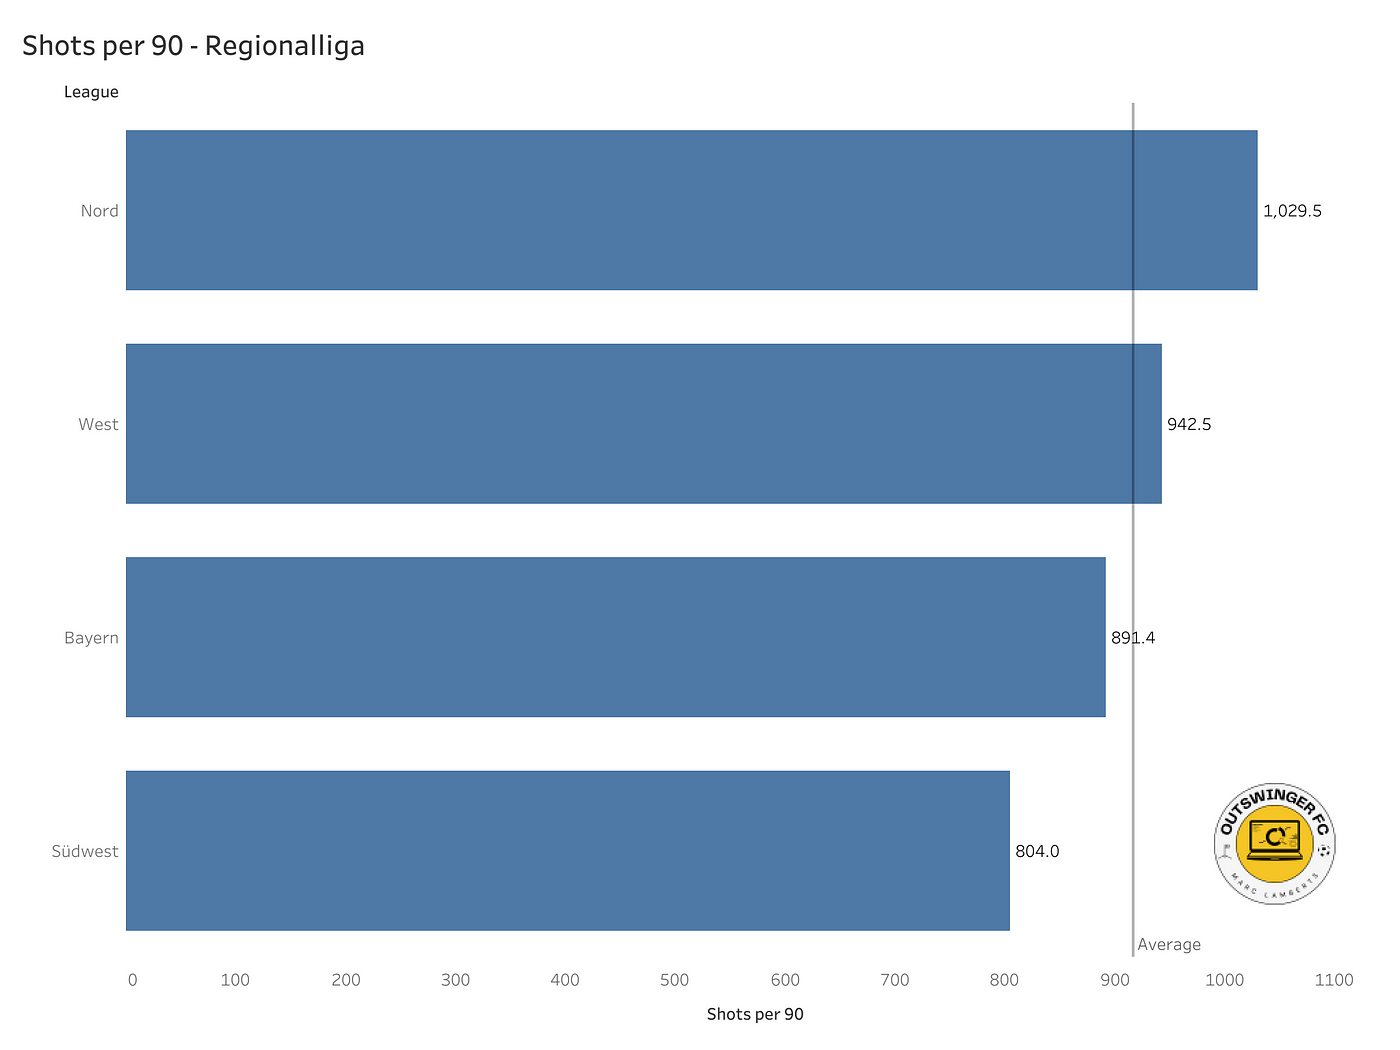
In the bar graph above you can see the four Regionalligas we are looking at and we can see the shots per 90 per league.

As we can see the volume of shots per 90 is the highest in the Regionalliga Nord and the lowest in the Regionalliga SĂźdwest. West and Nord are above the average while Bayern and SĂźdwest are below the average.

It’s too early to have a conclusion ready but it looks like the emphasis on more shots is prevalent in Nord and West, which could indicate they look to shoot more.

Expected goals

In the bar graph above you can see the four Regionalligas we are looking at and we can see the xG per 90 per league.

It gives us the same idea, but Regionalliga Nord is just a different league in comparison with West and Bayern. SĂźdwest is the other outlier and we can draw a simple conclusion: there are fewer shots and as a consequence, there is also a lower xG per 90 in that specific league.

Conclusion

I think it’s very hard to draw definitive conclusions just from a few data points, but it has to trigger your mind that not all regional leagues are the same.

But, if we are looking to use these metrics for forwards, there are two quite interesting conclusions to draw:

  • If you have a high number of shots and xG in Regionalliga SĂźdwest, that means more than in the Regionalliga Nord.
  • If you have low shots in Regionalliga SĂźdwest it’s less damning than having it in Regionalliga Nord

We can of course go deeper into this, but it’s important to link the individual clubs to the league they are playing. If we want to gauge whether a match can be made to the 3. Liga for example, it’s important to look at the league the player is in. Not all 4th tiers are the same.

The idea behind the threat: Creating Pass Progression Score (PPS)

What has always fascinated me is the way we look at football players and the value we give those players. There is a pecking order of course, because in terms of the general football audience, we tend to value entertainment. Entertainment is something you can directly compare to the ones making the goals (which is good) and those conceding them (which is bad). This idea has been with me for a long time and I want to look a little deeper into this idea.

Read more: The idea behind the threat: Creating Pass Progression Score (PPS)

I think I grew up with that idea too, that I valued goals more than anything else because goals eventually will make the difference between winning, drawing, or losing. However, when I started learning more and more about the game — I realised: it’s only about the output, but also the process of getting there. And, that’s what I’m doing more and more. That’s why today I want to look at creating a new metric: Pass Progression Score.

Contents

  1. What is Pass Progression Score?
  2. Why do we need it?
  3. Data
  4. Methodology
  5. Visualisation
  6. Final thoughts

What is Pass Progression Score?

Pass Progression Score is a metric that combines a few different metrics that indicate how much progression there is by a specific player by looking at the total number of passes and calculating the progressive value of it. The specifics and methodology will come later in this article.

The score will show how much a player in a specific position contributes to progression and how much of his/her total contributes to progression. This gives us an idea of progression.

Why do we need it?

Well, needing it is quite the statement, but I think it will be interesting and help gauge whether a player is a progressive passer. In recruitment processes we have to look at data over so many players and to make our lives easier with a few steps, we can create scores to look at intention. Yes, that’s right — intention. The intention of the players can help us get a better idea of the style of the player and if you are looking for a player that has a certain progressive passing profile, this is a metric that can really help you.

Data

The data we are using for this metric comes from Wyscout. Like I’ve said before, it’s not the best quality provider out there but it has the widest coverage. The data we are using is from the Belgian First Division 2023–2024 and we are only using players that have at least played 900 minutes — which is the equivalent of 9 full matches. The data was collected on June 9th, 2024.

The data will be selected and will contain only a few specific metrics, which will then be used in the calculation for the newly created metric. You can see that below.

Methodology

So how am I going to make this score? I will do this in Python, but there are 3 steps I need to take:

  1. Drop all the information I don’t need. I will keep the player name, team name, minutes played, and the metrics I use.
  2. The metrics I’m using are: Passes to the final third, Passes to the penalty area, Key passes, Through passes and Progressive passes. All are per 90 minutes and not totals.
  3. I will weigh the different metrics for how much they contribute to progression: Passes to final third (1), passes to penalty area (2), Key passes (1), Through passes (1), and Progressive passes (3). The key aspect is here that progression is more valuable to me when it comes closer to the opposition’s goal.
  4. I will calculate them into z-scores, which will make it easier to create a weighted total score.

To create a score that goes from 0–1 or 0–100, I have to make sure all the variables are of the same type of value. In this, I was looking for ways to do that and figured mathematical deviation would be best. Often we we think about percentile ranks, but this isn’t the best in terms of what we are looking for because we don’t want outliers to have a big effect on total numbers.

I’ve taken z-scores because I think seeing how a player is compared to the mean instead of the average will help us better in processing the quality of said player and it gives a good tool to get every data metric in the right numerical outlet to calculate our score later on.

Z-scores vs other scores. Source: Wikipedia

We are looking for the mean, which is 0 and the deviations to the negative are players that score under the mean and the deviations are players that score above the mean. The latter are the players we are going to focus on in terms of wanting to see the quality. By calculating the z-scores for every metric, we have a solid ground to calculate our score via means.

We talk about harmonic, arithmetic, and geometric means when looking to create a score, but what are they?

The difference between Arithmetic mean, Geometric mean and Harmonic Mean

As Ben describes, harmonic and arithmetic means are a good way of calculating an average mean for the metrics I’m using, but in my case, I want to look at something slightly different. The reason for that is that I want to weigh my metrics, as I think some are more important than others for the danger of the delivery.

So there are two different options for me. I either use filters and choose the harmonic mean as that’s the best way to do it, or I need to alter my complete calculation to find the mean. I am doing the harmonic mean.

Visualisation

By running the code and calculation in Python — I will get a list. Now, that’s just a very boring-looking list, so I’m turning it into a visualisation. In the image below you can see the 10 best progressive pass score (PPS) players with at least 900 minutes in midfield.

In the table above I have ranked the top 10 midfielders according to this new metric. They have a score from 0–100 and in that way we can see how well they are doing in this metric.

What is something we can conclude from this table is that Tresor scores significantly higher in this score than the others on this list, meaning that he scores far above the mean and is an excellent intentionalist in terms of progressive passing.

Final thoughts

I like to play around with metrics and see how they can aid myself in the process of recruitment, especially in the phase where I use data quite heavily.

Progression can be measured in different ways and that’s also why I think there is still work to be done on this metric. If you connect OBV, xT or xPass to these metrics — we can delve even further. In combination with the vlaue of event data, the 2.0 version of PPS will be even more meaningful.

Proactive vs Reactive defence score: Measuring in what way defenders like to engage in defensive activities

I was thinking the other day that developing metrics is completely based on bias because the creator of said metric has particular intentions with it. That made me think about whether I should publish my thoughts on a new metric I developed. Not because I think it’s bad, but because it might not be useful to everyone and I don’t want to be portraying some flawed metric as gospel.

After a while I realised that is not always about the end product, but more about the process. My thought process can be useful to myself and to others, whether they use this metric or develop their own. So, here I am and I’m going to talk about a new metric today: Proactive vs Reactive Defensive score.

Lees verder: Proactive vs Reactive defence score: Measuring in what way defenders like to engage in defensive activities

Contents

  1. Data
  2. Why this metric?
  3. How to calculate it
  4. How to use it
  5. Example I: WS:
  6. Example II: La Liga
  7. Conclusions

Data

The data I’m using for this metric is Wyscout data, but you can also build this with other data providers because they all register some sort of tackles and interceptions in their metrics. This is pivotal for these metrics, and I will explain later in the part of “How to calculate it”.

The data was collected from Wyscout on May, 17th 2024 and I have collected over 100 leagues, but the ones I’m going to work with are the following leagues:
– WSL 2023/2024 (Women)
– La Liga 2023/2024 (Men)

Important is that I filter for defensive players (defenders + midfielders) as it will help me assess pure defensive actions rather than pressing actions. I can’t 100% include/exclude these events, but the likelihood will be higher this way.

How to calculate it

First of all, you need to have all the defensive actions that are available. And, for this, you will need all the actions and not the successful actions. It’s about intent and not about concrete performance. All metrics I’m using are per 90 and are not adjusted for position.

I’ve added them all up so I get a total number of defensive actions:
– Aerial duels
– Defensive duels
– Shots blocked
– Interceptions
– Sliding tackles

This becomes a new metric, the total defensive actions per 90. What I do next is that I want to calculate two scores that give an idea of how many of those total actions are proactive or reactive:

# Calculate the Proactive defensive score as interceptions % of the total defensive actions
df[‘proactive_defensive_score’] = df[‘Interceptions per 90′] / df[’total_defensive_actions’]

# Calculate the Reactive defensive score as sliding tackles % of the total defensive actions
df[‘reactive_defensive_score’] = df[‘Sliding tackles per 90′] / df[’total_defensive_actions’]

I’ve calculated this above in Python — if you want the full code for this, subscribe to my Patreon for the full article + code + database — and calculate the scores for proactive defensive scores and for reactive defensive scores.

The final step is to make a ratio. You will have to compare both scores we have calculated above, to each other to assess a player’s defensive action performance. In other words, finding a scale where the score 50 is completely in balance, 0 is the most reactive defensive player and 100 is the most proactive player.

So in the end, you will have scores from 0–100 on the Proactivity-Reactivity scale.

How to use it

This scale is calculated for every player in your database and will be calculated in relation to the whole database.

This metric gives you an idea of intention. If you want to select/scout a player who’s more proactive in his actions and progresses the ball forward via an interception action, this scale can be useful in assessing that. But, also in the case of the defensive player being a more no-nonsense player in defence, this scale can help you in assessing this through data.

Like with any data metric, it’s of great importance to create more context into your tasks. I am of the opinion that data is incredibly useful, but without any context — it’s practically useless.

Example I: WSL — England

In the table above you can see an example of how we can look for the most proactive player in the WSL. We are looking for the scores closest to 100 and by doing so we find the top 10 of players who are the most proactive in their defence.

As we can see we see the most proactive defensive players in both Manchester sides: Manchester City and Manchester United. They look to ask the proactivity of their defensive players.

Example I: La Liga — Spain

In the table above you can see an example of how we can look for the most proactive player in La Liga. We are looking for the scores closest to 100 and by doing so we find the top 10 of players who are the most proactive in their defence.

As we can see we see most proactive defensive players comes from Osasuna, the rest are evenly divided with 1 player.

Conclusions

Looking into this metric and working with some thoughts have crossed my mind. First of all, it’s not waterproof and has a lot of work to be done for version 2.0.

Secondly, it’s difficult to assess whether an action is made in defence or as a pressing action, which can have different outcomes for the progression of the game.

Relating it to all defensive actions per 90 can lead to different results, because not every player is involved in the number of defensive actions nor does it necessarily say something about their quality.

All in all, these are things I need to look more closely at for the update on this metric so that it proves to be more trustworthy for day to day use.

For the full code and database, you can subscribe to my Patreon here: https://www.patreon.com/outswingerfc