How many more expected models do we need? That’s surely a question I have asked myself numerous times while researching the article I am presenting today. I think it all depends on the angles you present your research with and how you approach the research: what’s the aim and what do you want to get out of it?
For me, it’s important to create something that adds something to a conversation about expected value models when I or others make a different model. This can be done by creating a completely new model or metric or recreating a model with enhancements. A combination of the two is also possible, of course.
In this article, I want to talk a little bit more about crosses. It is not so much about cross delivery or cross completion percentages, but what successful follow-up action does entail: shots from crosses and the expected models.
First I will talk about the data and how I have collected it, secondly about the methodology, followed by the analysis of the data and last I will give my final thoughts or conclusion.
Data
For this research, I have used raw event data from Opta/Statsperform. The event data was collected on Thursday, 30 January 2025, focusing on the 2024–2025 season of the Belgian Pro League, the first tier in Belgium football.
The data will be manipulated to have the metrics we need to make this calculation work. The players featured will have played a minimum of 500 minutes played throughout the season.
For this research, we won’t focus on any expected goal metrics, as we are not looking for the probability of a goal being scored.
Why this metric?
This is a question I ask myself every time when I set out to make a new model of metric. And sometimes I really don’t know what to answer. The fundamental question remains: do we need it? I guess that’s a question of semantics, but no — I don’t think we need it. However, I believe it can give us some interesting insights into how shots come to be.
The place where I come from is to understand what expected assists or expected goals assisted tell us. These metrics tell us something about passes with a probability of leading to a goal with the key difference between all passes and passes leading to shots. I love the idea of it, but it’s very much focused on the outcome of the shots and expected goals.
I want to do something different. Yes, the outcome will be a probability, but it focuses on the probability of a shot being taken rather than a shot ending up a goal. Furthermore, I want to look at the qualitative nature of the crosses and whethter we can asses something from the delivery taker. In other words, does the quality of the cross lead to more or less shots in similar variability.
Cross: a definition
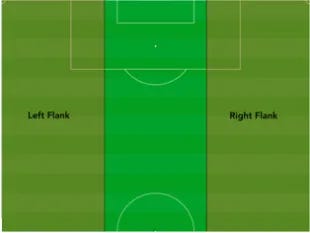
What is a cross? If we look at the definition of Hudl, we can say the following what constituates as a cross: A ball played from the offensive flanks aimed towards a teammate in the area in front of the opponent’s goal.
In this instance a flank is the utmost 23 meters in a 68 meter wide pitch. This means that everything on the right or left that is a pass from the flank to the central area, can be considered a cross.
Credit: Glossary Wyscout
As we look to Opta/Statsperform data and are using that in our research, let’s see what their definition is: A ball played from a wide position targeting a teammate(s) in a central area within proximity to the Goal. The delivery must have an element of lateral movement from a wider position to more central area in front of Goal.
If we take some random data for crosses, we can see where crosses come from and what metrics we can pull from them. This is essential for our research into a model and we need to understand what we are working with.
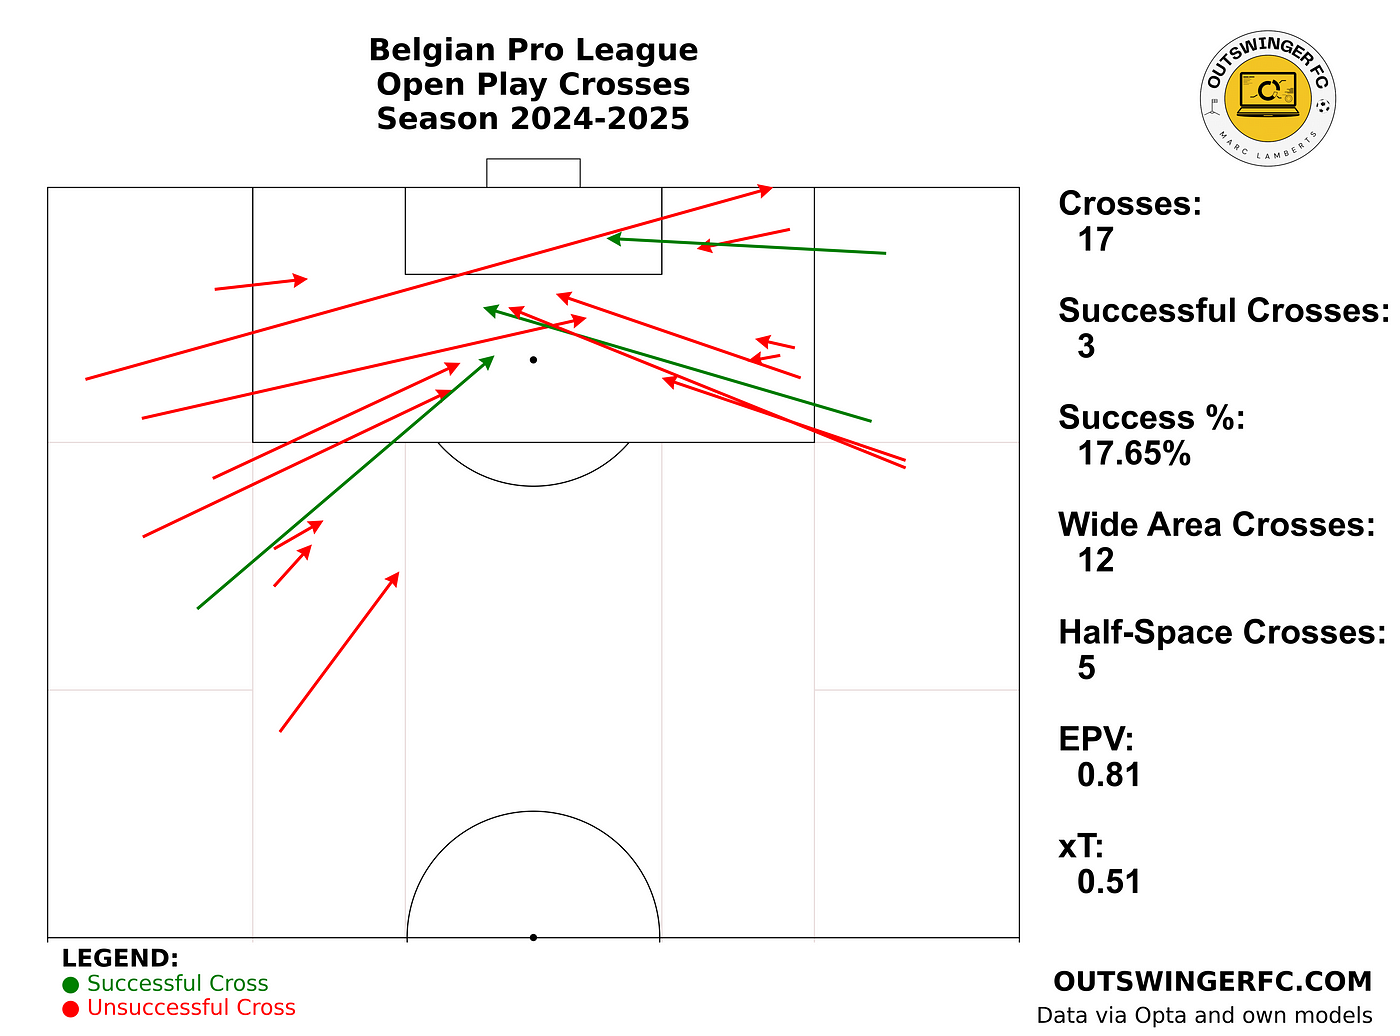
In the image below you can see a pitch map with crosses visualised.
We visualise the crosses coming from open play, so we filter out the set pieces and we make a distinction between successful and unsuccessful passes. On the right side we see some calculation of the crosses which we can also use to work more with. EPV is expected possession value and xT is expected threat.
Methodology
So the thing is that I want to create a model from the crosses we visualised. The aim is to get a model that calculates probability for every cross turning into a shot. There are a few things we need to take from the event data:
Cross origin (location on the field)
Receiving player’s position (inside/outside the box, near/far post, penalty spot based on endlocation of the cross)
Game context (match minute, scoreline, opposition quality)
The first step involves organising the dataset by sorting events chronologically using timestamps. Then, the model identifies cross attempts (Cross == 1) and assigns a binary target variable (leads_to_shot) by checking if the next three recorded events include a shot attempt (typeId in [13, 14, 15, 16]). This ensures that the model captures sequences where a cross directly results in a shot, preventing the influence of unrelated play sequences. These include a missed shot, shot on the post, shot saved or a goal.
After defining the target variable, feature engineering is applied to improve model performance. Several factors influence the probability of a cross leading to a shot, such as the location of the cross (x, y), its target area (endX, endY), and the total time elapsed in the match (totalTime).
The dataset is then split into training (80%) and testing (20%) sets, ensuring that the distribution of positive and negative samples is preserved using stratification.
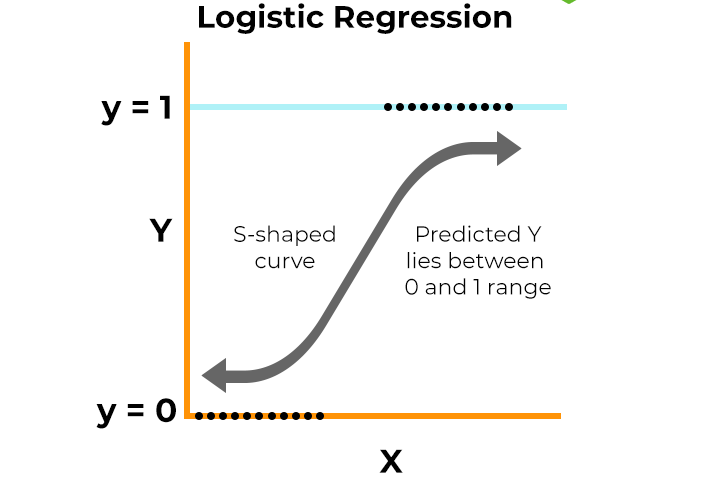
To estimate the probability that a cross leads to a shot, machine learning models are applied. A Logistic Regression model is trained to predict a probability score for each cross, making it an interpretable baseline model.
In the context of xCross, the goal of the model is to predict whether a cross will lead to a shot attempt (leads_to_shot = 1) or not (leads_to_shot = 0).
Additionally, a Random Forest Classifier is trained to capture non-linear relationships between crossing characteristics and shot generation likelihood. Both models are evaluated using accuracy, ROC AUC (Receiver Operating Characteristic — Area Under Curve), and classification reports, ensuring their ability to distinguish between successful and unsuccessful crosses in terms of shot creation.
Analysis
Now we have an excel file with the results for every cross in our dataset, containing the probability of it leading to a shot in the first three actions. Now we can start analysing the data.
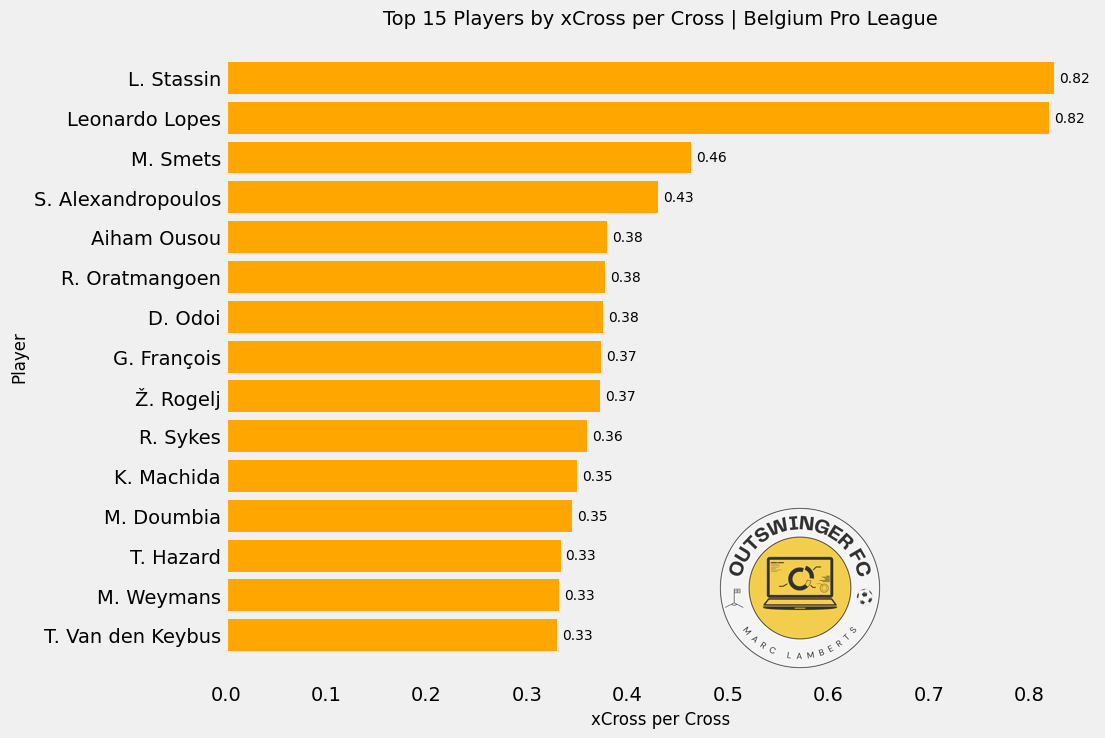
First we can look at the player who have the highest xCross number in the 2024–2025 season so far.
As you can see in the bargraph above, these are the top 15 players who are most likely to give a cross that leads to a shot. When we look at Stassin, for every cross he takes, 82% of them will lead to a shot in the next 3 actions.
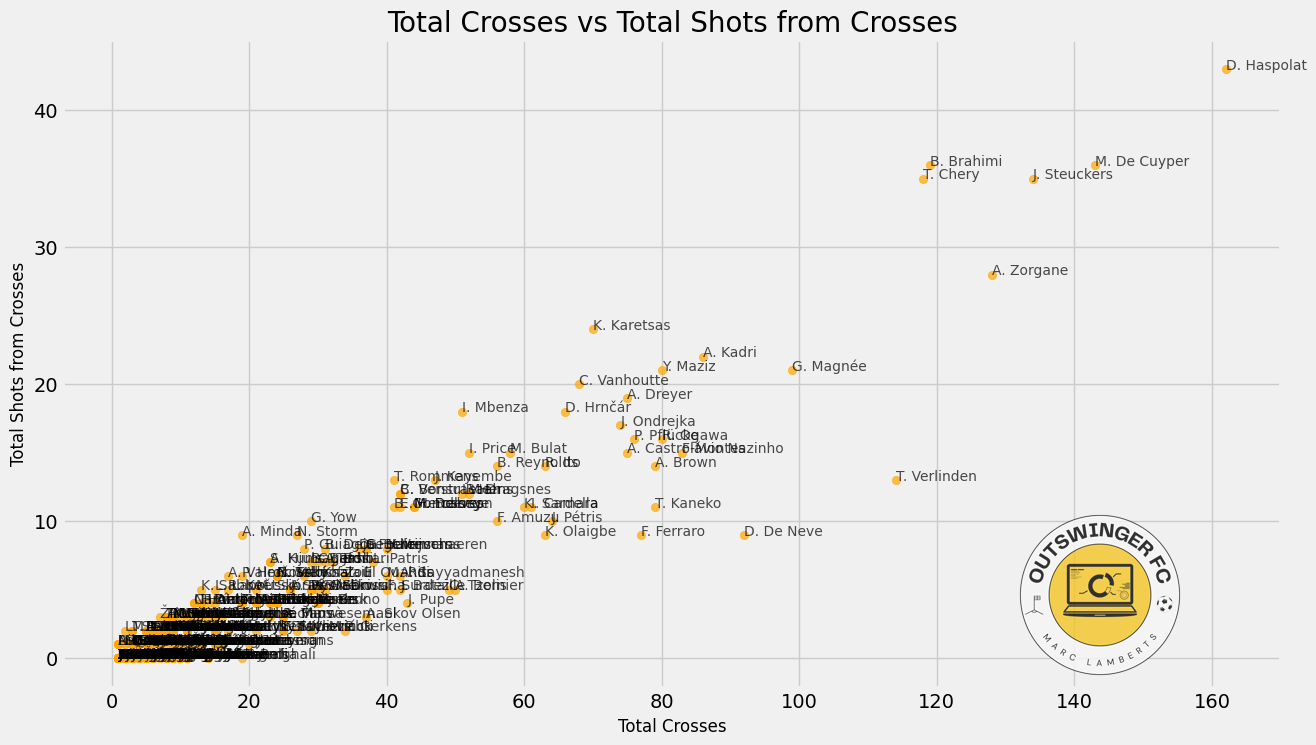
In the scatterplot below you can see the total number of crosses with the crosses leading to shots in the next 3 actions.
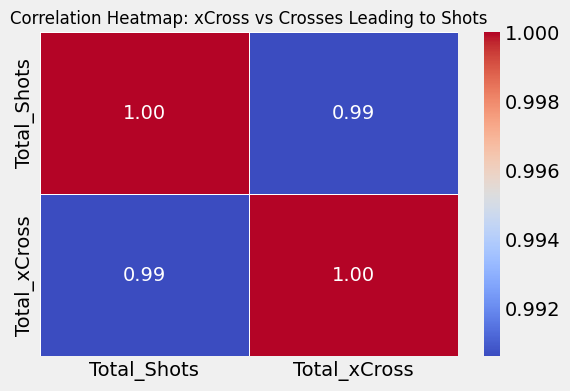
What I want to try to do is to find the correlation between shots from crosses and the probability of shots coming from crosses. That’s what we can see in the correlation matrix.
As you can see the correlation is very high with 0,99 correlation to 1 shot from xCross. There is a positive relation and that’s something we need to think on.
Final thoughts
Looking ahead, further improvements could include incorporating player movement data, defensive positioning, and match context to refine shot prediction accuracy. Testing more advanced models, such as XGBoost or deep learning, could help capture complex interactions between crossing characteristics and shot outcomes. Additionally, fine-tuning the Random Forest hyperparameters could further optimise performance. Ultimately, these refinements can provide deeper tactical insights.
Do you ever look at a player and think: I don’t exactly know what to make of you? That’s what I have with Stina Blackstenius and her period at Arsenal. She is a good player, but how impactful is she? That’s something I will try to find out using data in this article.
We will use data and video to illustrate how Blackstenius has done in the WSL 2022/2023 and we will focus on the striker position.
Contents
Biography
Seasonal stats
Positions/roles
Ball progression
Dribbling
Key passing
Shooting
Assisting
Expected goal contribution
Comparison with peers
Final thoughts
Biography
Name: Stina Blackstenius
Date of birth: 05–02–1996
Nationality: Swedish
Position: Striker
Contract expires: 30–6–2026
Current club: Arsenal
Previous clubs: Vadstena GIF(Y), Vadstena, Linköping FC, Montpellier, Linköping FC, Göteborg FC, BK Häcken, Arsenal
International: Sweden (107 games, 31 goals)
Marketvalue Soccerdonna: €185.000
The question is when we look at Blacktenius: what profile does she have? She is good at scoring goals and providing assists. She is good in the air and can link up pretty well. These things might suggest she could do a fantastic job as a striker.
We see her as a classical striker, but she can do much more on the pitch. Not only is she good at the goalscoring aspect of the game, but can also hold the ball very well, win aerial duels and can be used as a decoy in certain set plays. She could be more versatile than we think, and that’s the reason that we are looking at her today.
Seasonal stats
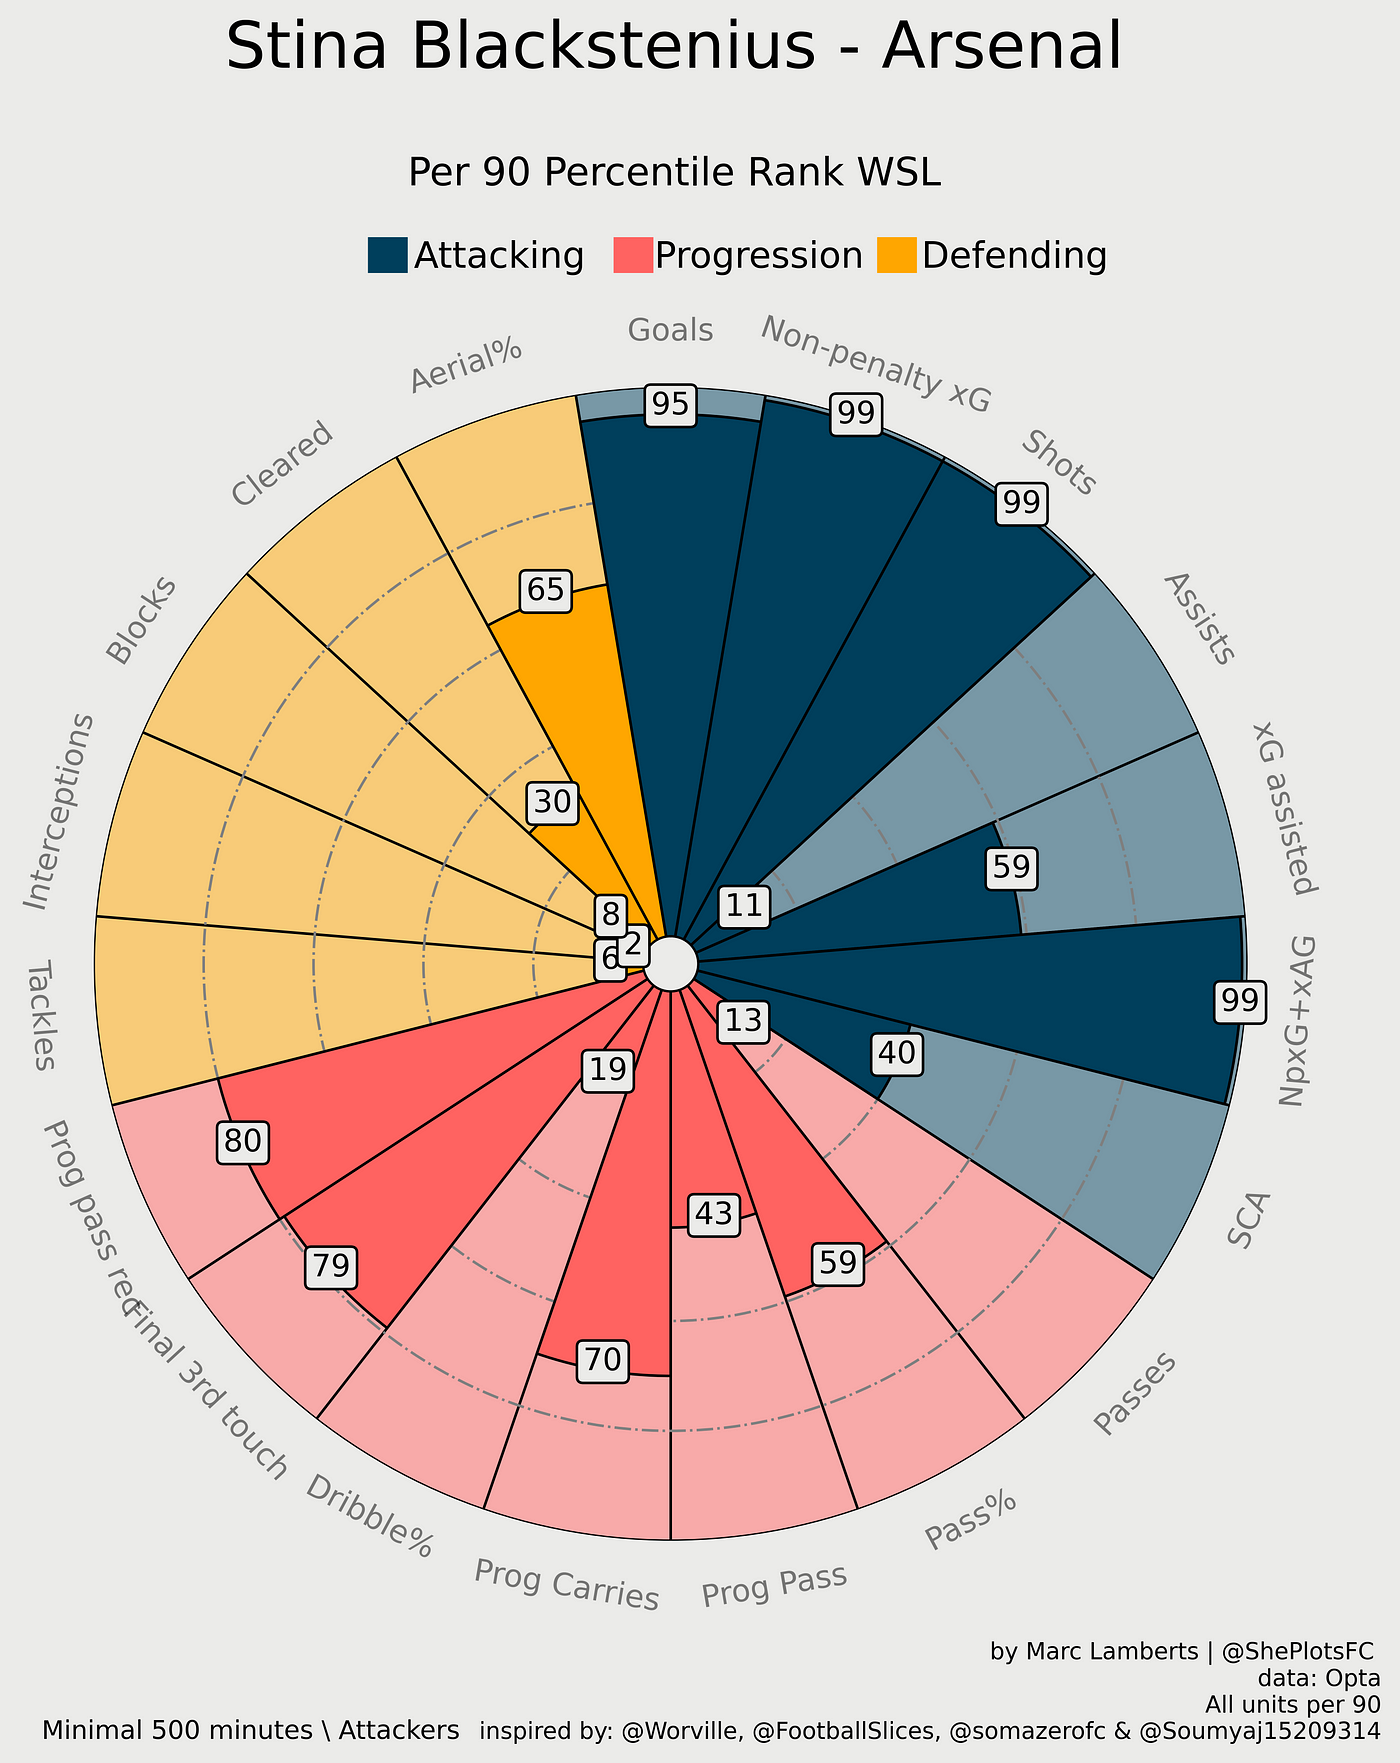
Data from Opta — all attackers included
If we look at this specific pizza plot, we can say a few things. But before we turn into the meaning, it’s good to stress that this mostly gives us a stylistic idea of the player rather than a definitive performance one. It’s also a general template used for all players, so it just gives us an indication.
What we can see is in the attacking metrics is that she scores well in the shooting metrics compared to her peers, but not great at the assists metrics and the shot-creating metric. This can explained as someone who is at the end of an attack, and not so much at the start of it.
In terms of the passing data, she does perform on average scoring low on the number of passes, the progressive passes and the dribbles. and higher on the progressive passes received, progressive carries and the touches in the final third. This can also be expected due to her position.
The defending metrics, aren’t something you should pay too much attention to if you would like to rate her overall, but one metric we will pay close attention to is the aerial duels won — this means that she is doing above average well in the air and when in defensive mode, she can clear a lot of balls. A valuable quality to have when you are defending set pieces for example.
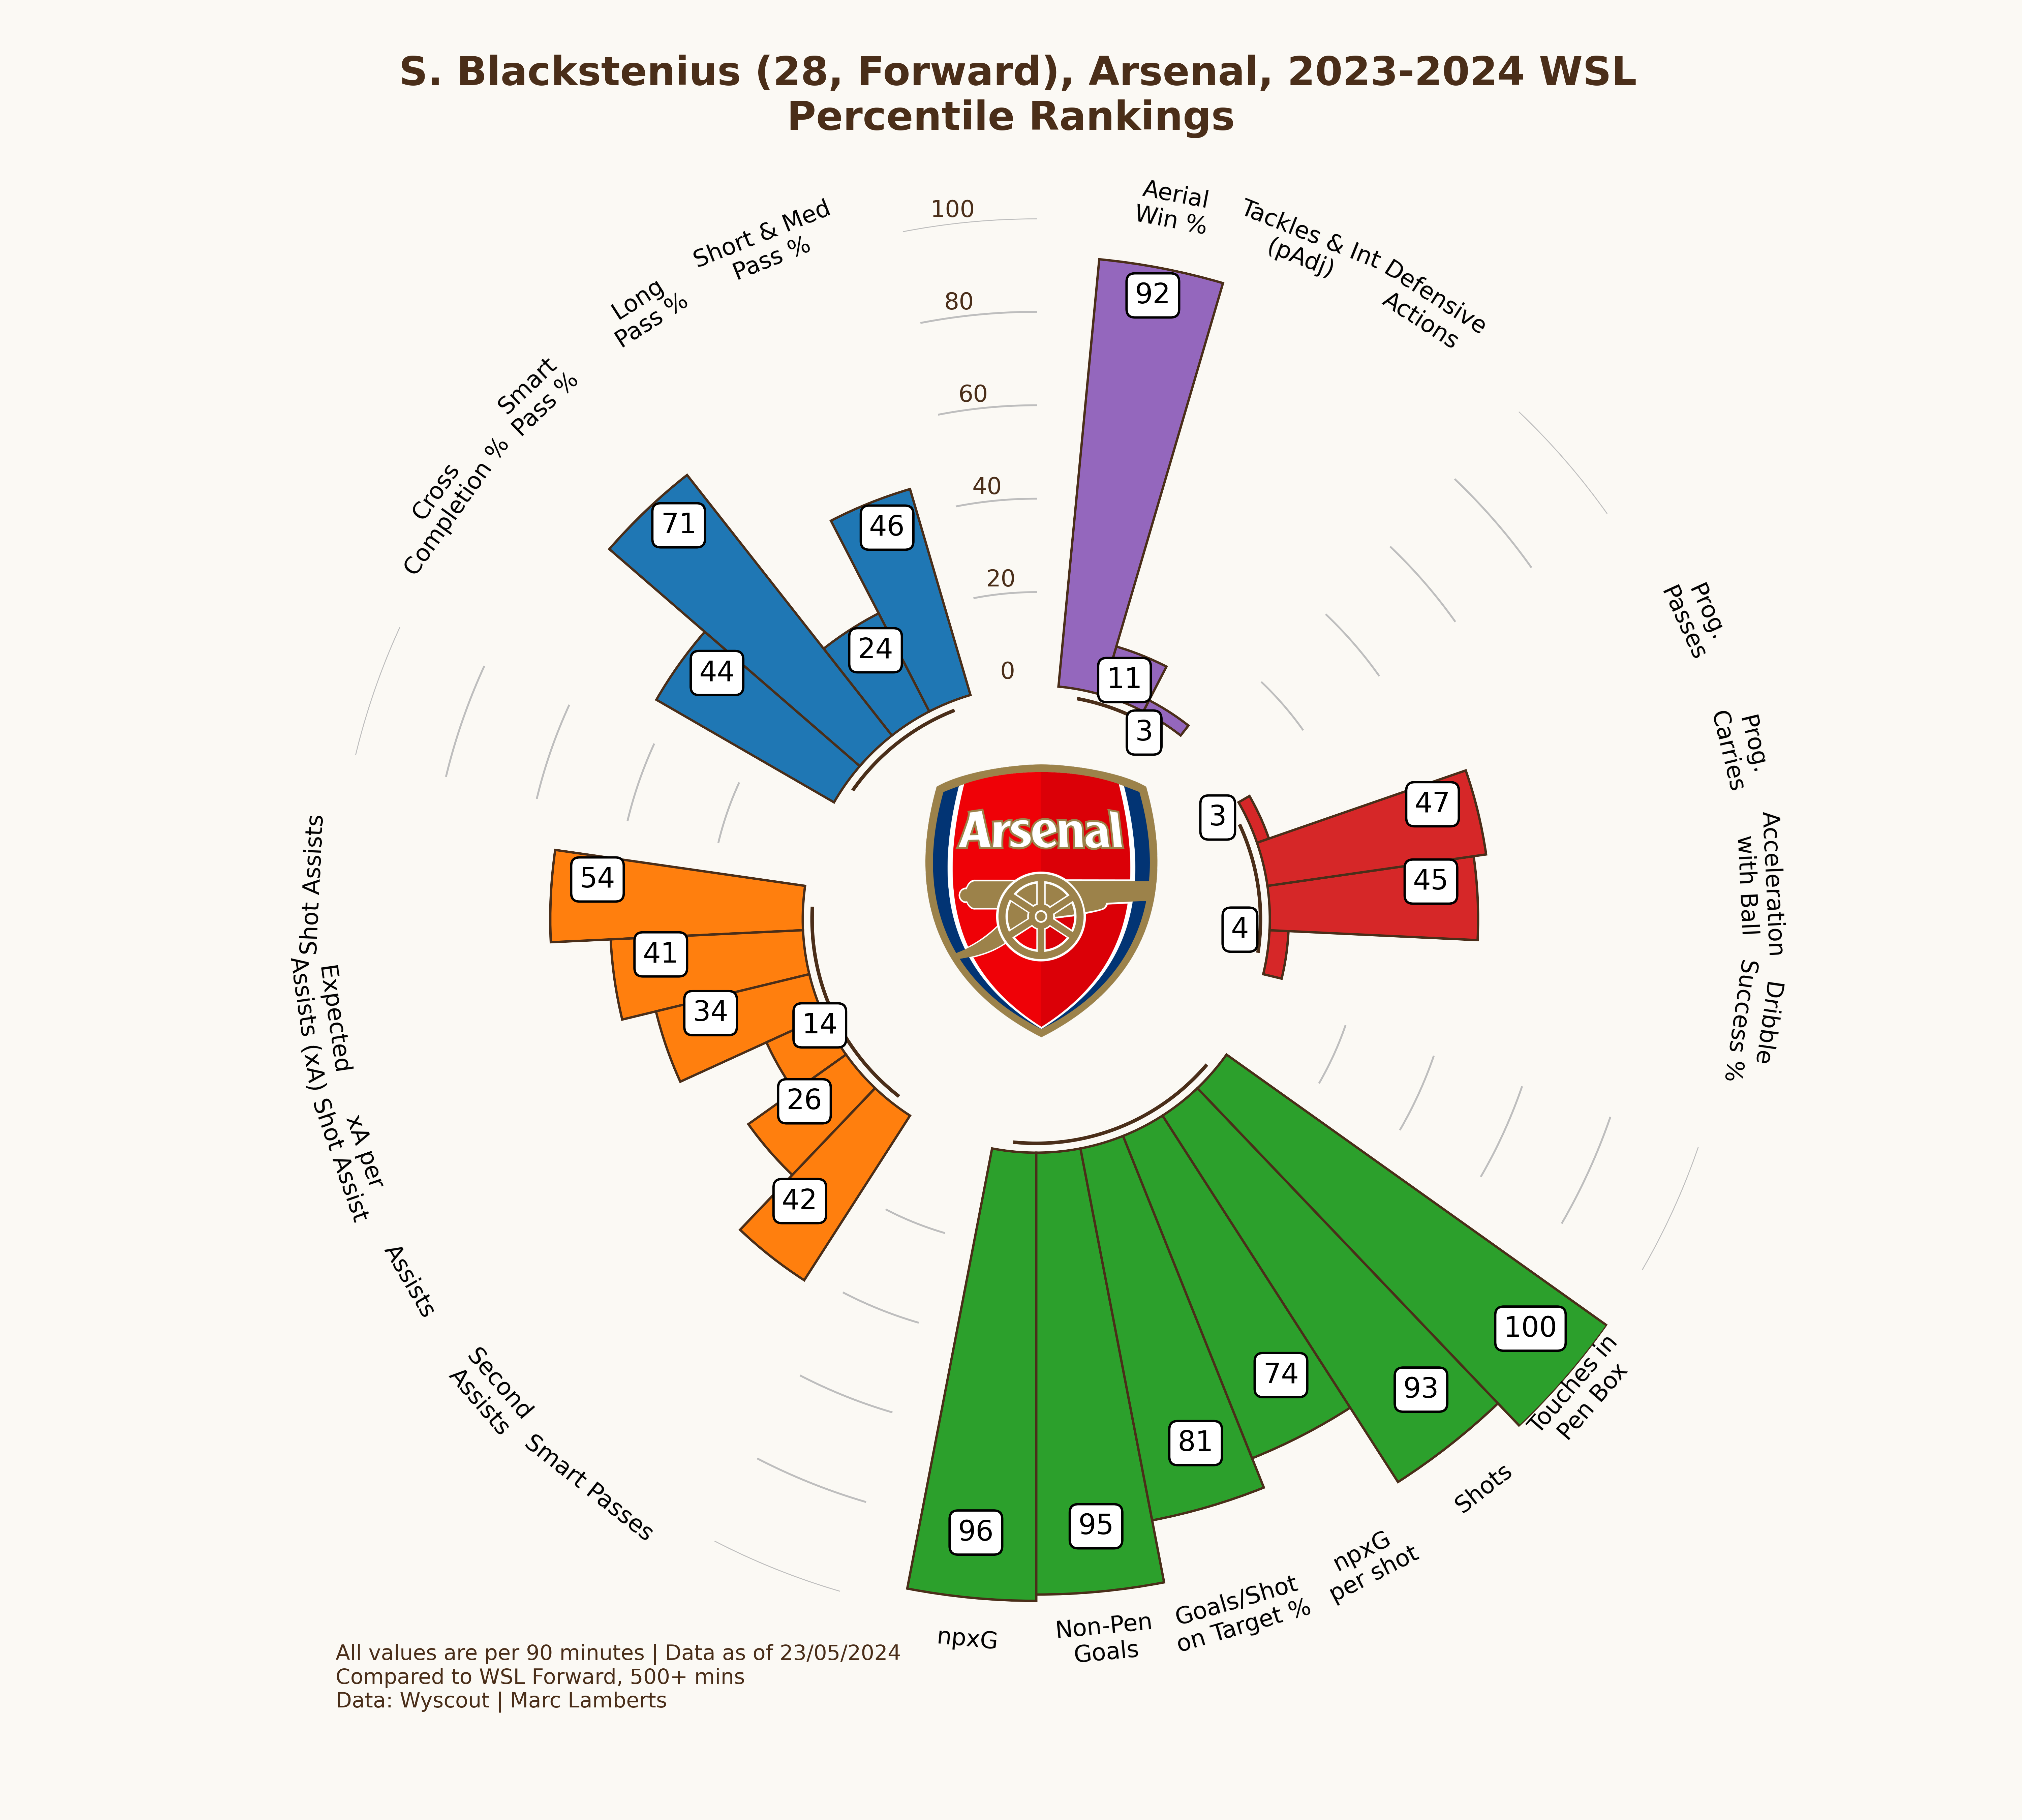
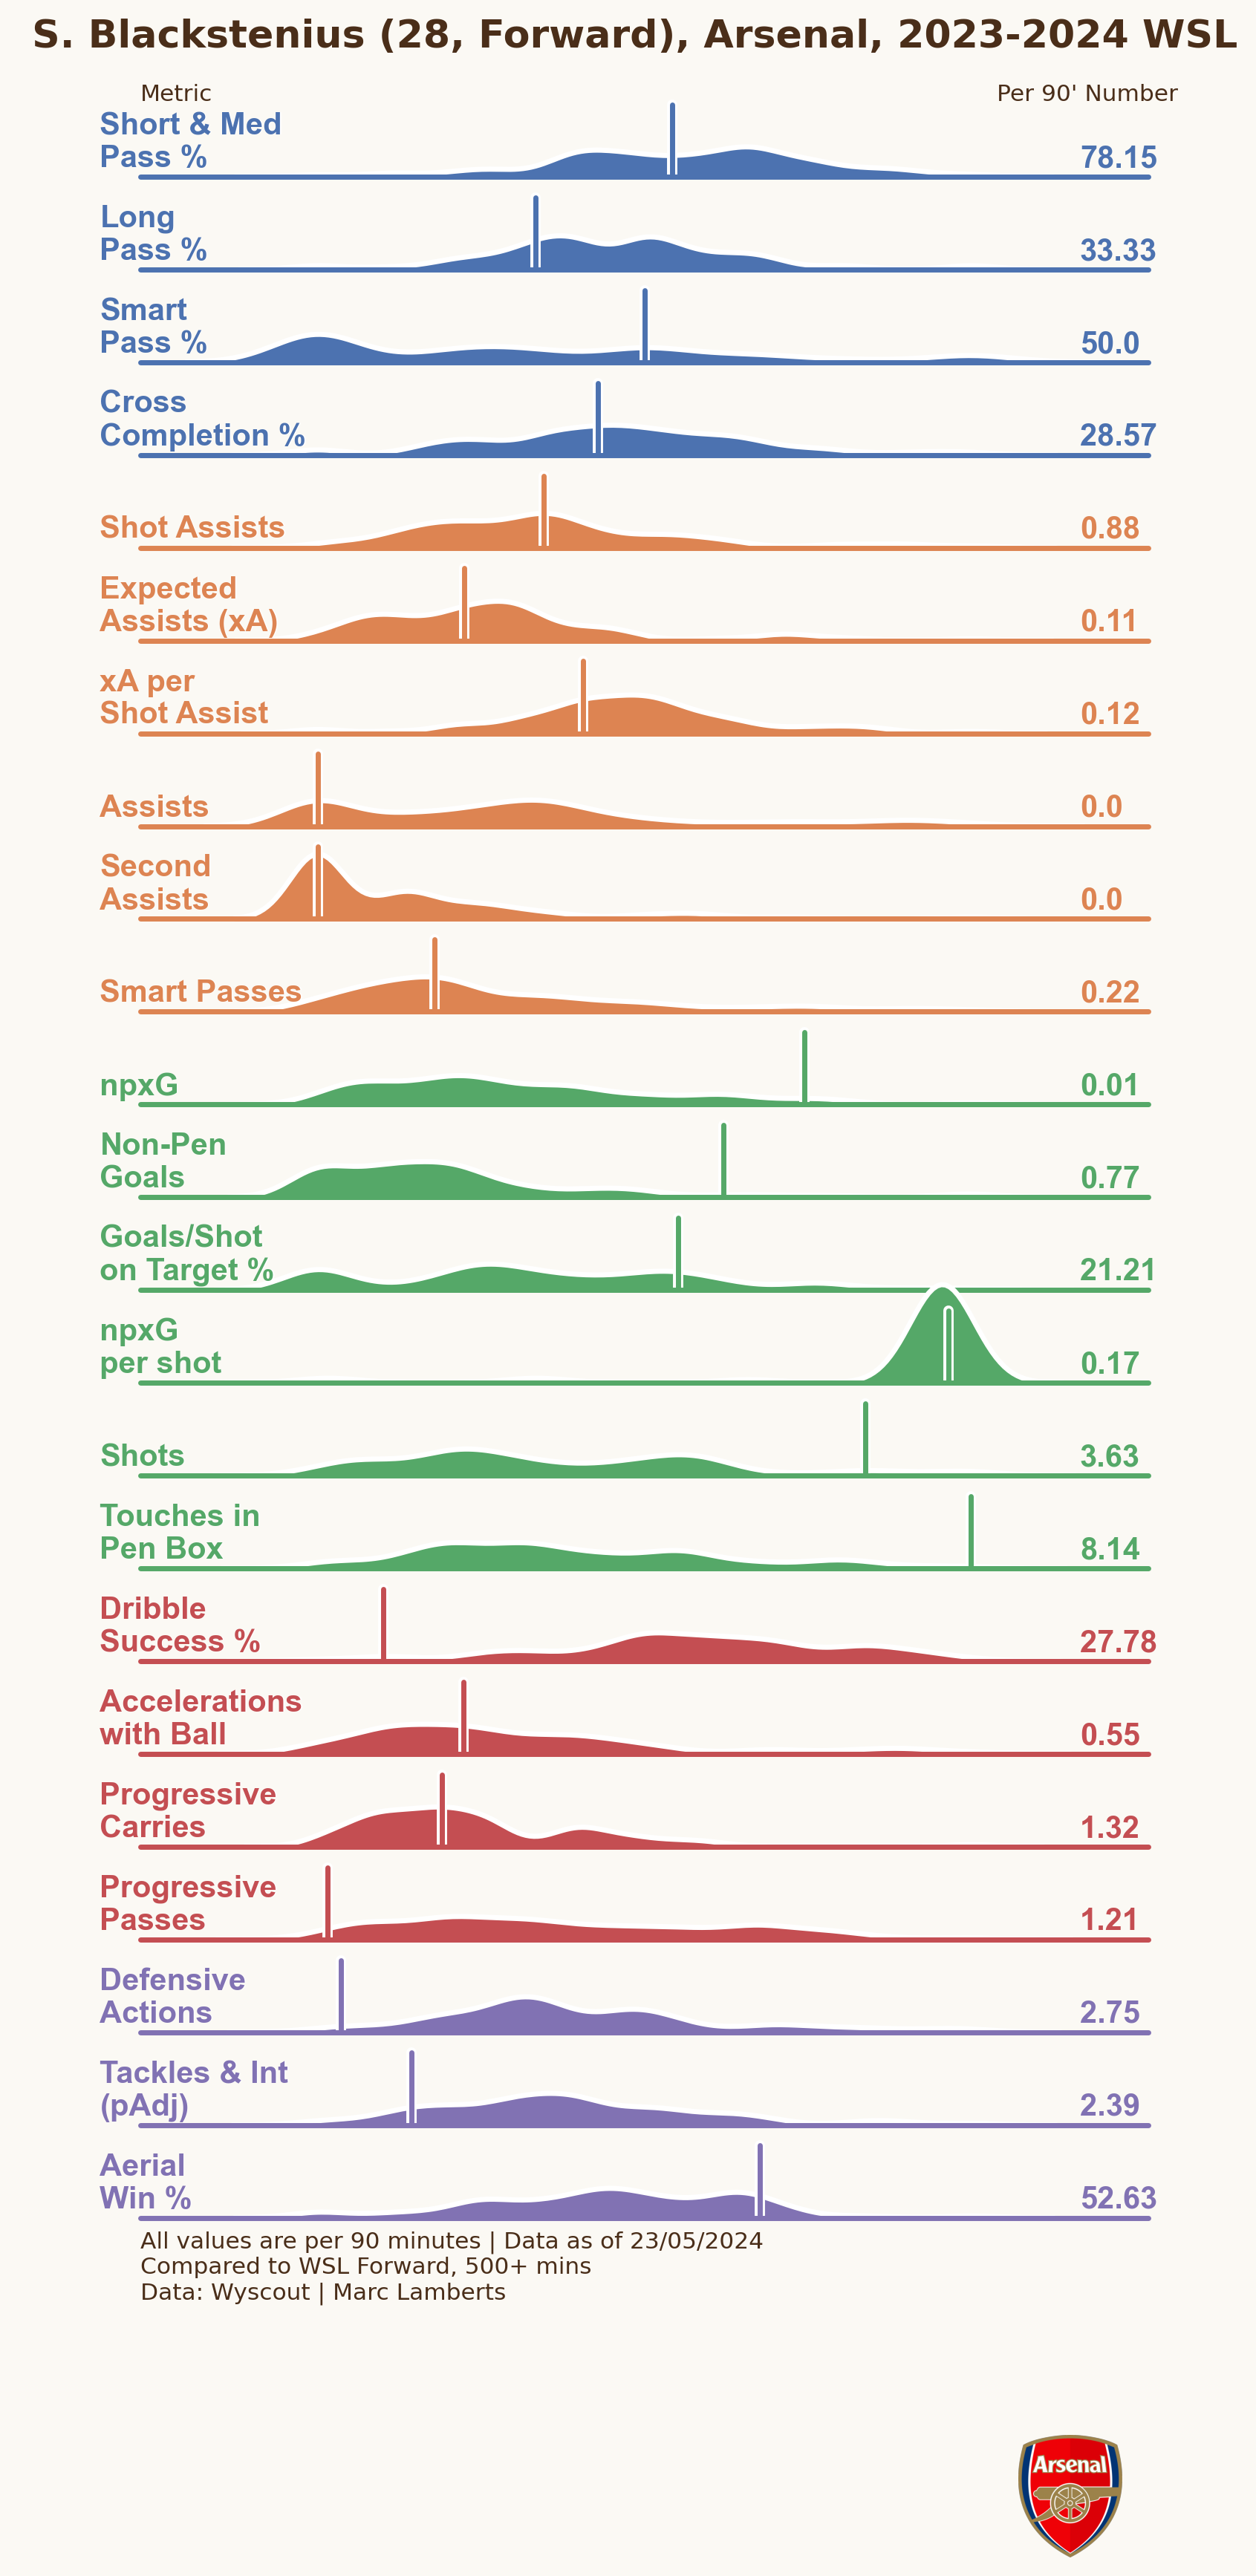
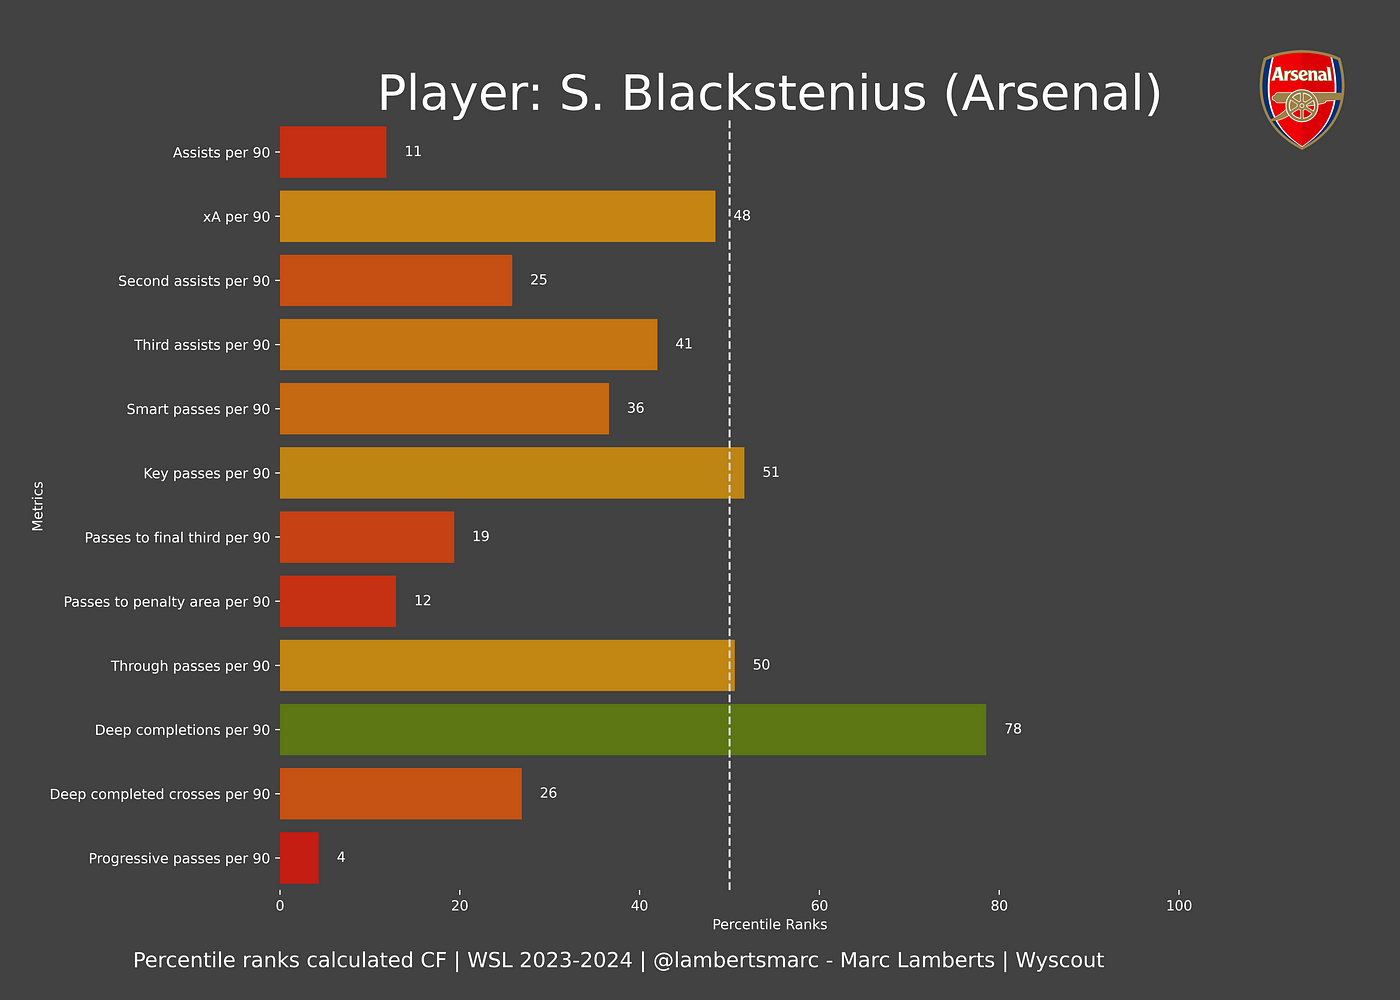
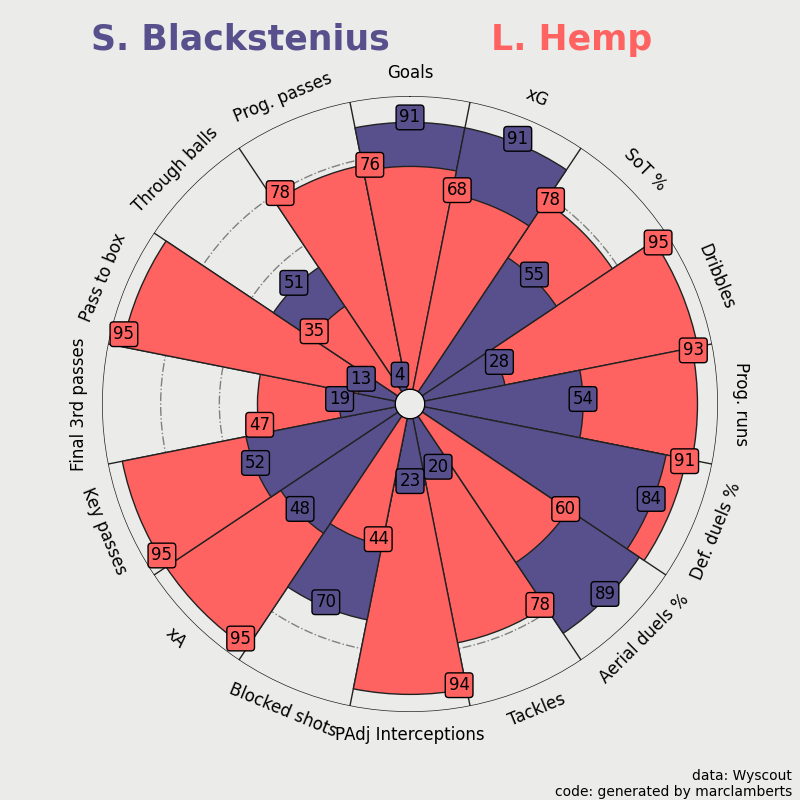
Data from Wyscout — compared to Forwards + Attacking midfielders.
Here you can see the more complete radar percentile ranks on the left, as you can see Blackstenius scores very differently in the different aspects, but in general, we can conclude: that she scores very high in the shooting metrics in green, is great in aerial duels, but scores quite average on anything else.
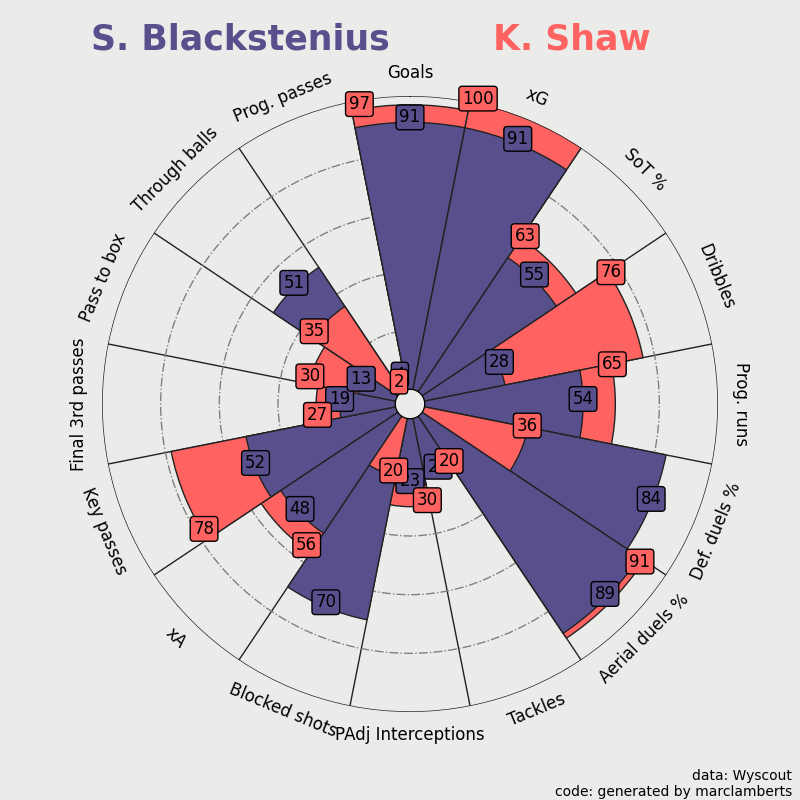
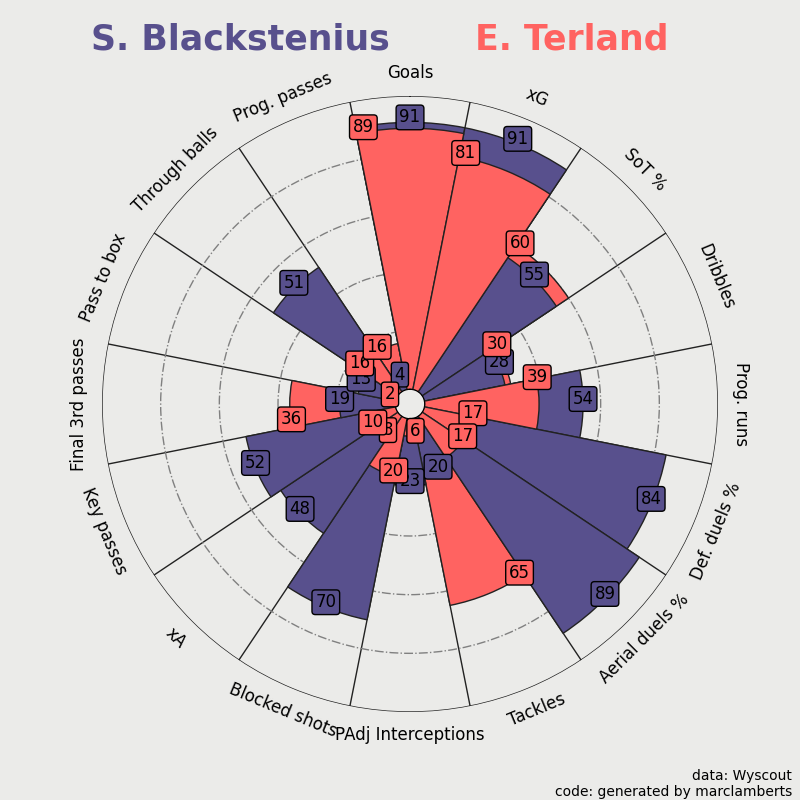
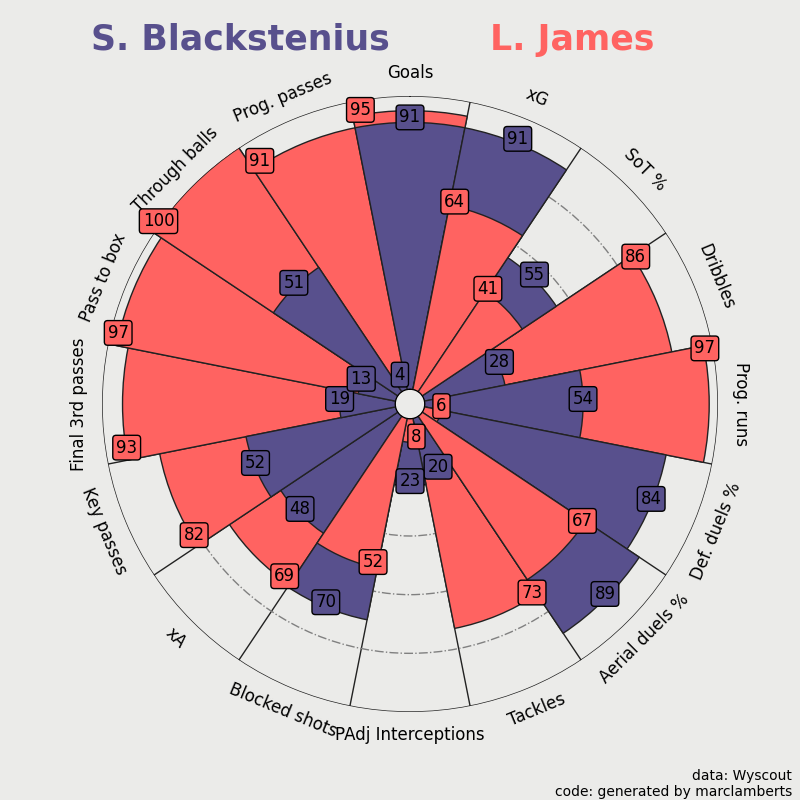
On the right you can see the same information, how she scores compared to her peers, but this time you see it in a different visual + the actual raw data is included as well.
Positions/roles
In terms of positions, there is not a lot of variety in where she plays. She plays as the striker in the different formations that Arsenal plays: 4–2–3–1 (81%) and 4–4–2 (9%) and others. The point is not to say Arsenal play this way and this way, but to emphasise that she can play as the sole striker, in a two or as the striker interacting with the wingers.
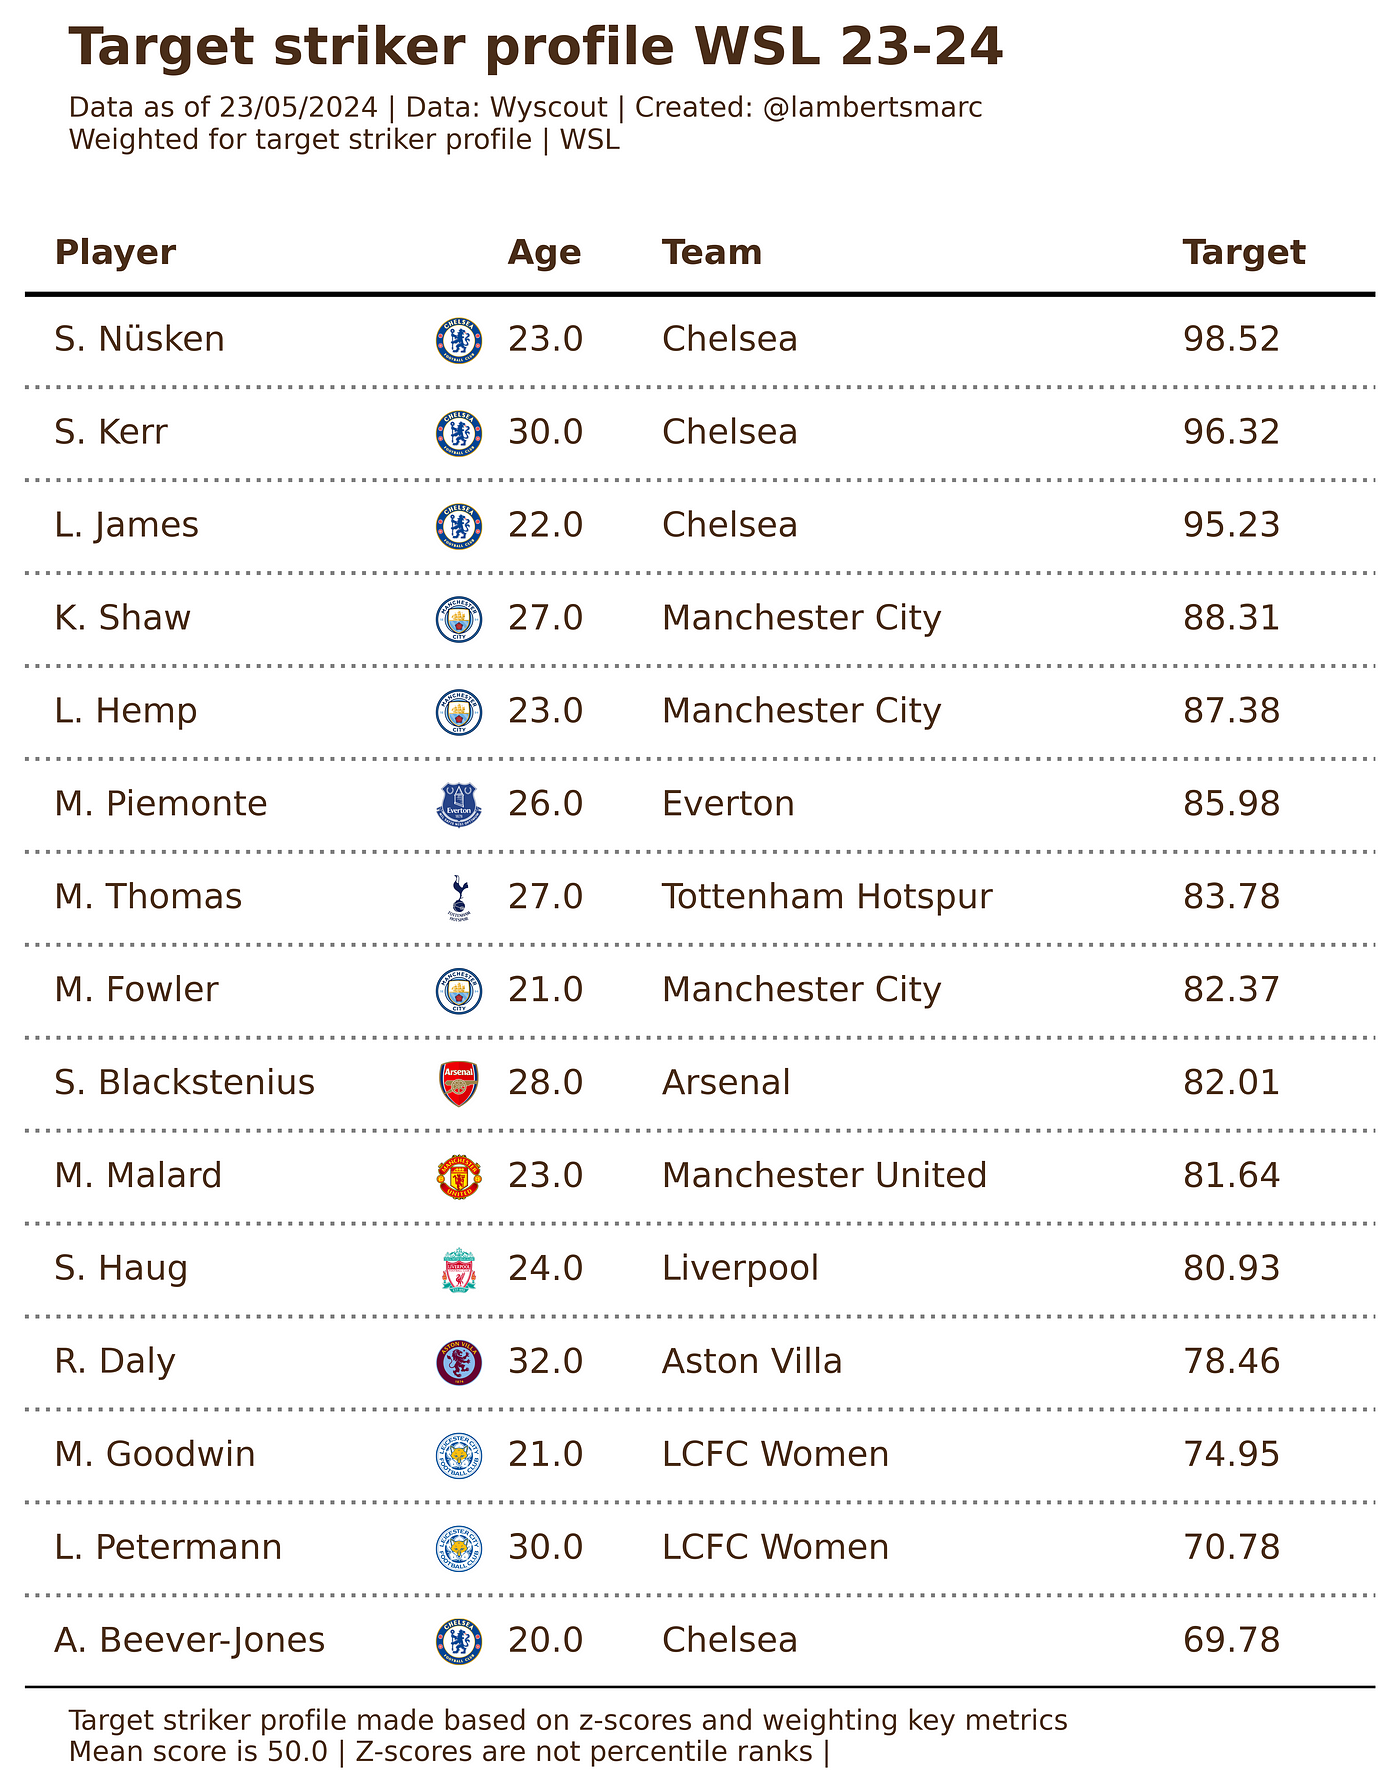
The more interesting question is what role she can play in an attack. There are four different roles in the attack, but only two are relevant: Target striker and goalscoring striker.
Here we took the data and put emphasis and weight on the key metrics for both roles. What’s interesting is that Blackstenius is in the top 15 of the target striker role according to z-scores, but for the goalscoring role — for what we mainly praise her — according to the data she has a score of 82,01 — which is means she closer to being a perfect fit to the role rather than to the mean score..
Now, what happens if we compare her to a goalscoring profile vs her peers?
Blackstenius scores 11th of all strikers if we look at the goalscoring role. While Blackstenius scores incredibly high in the shooting and xG metrics, her fit for a goalscoring striker isn’t 100% — which means that she is more versatile than thought before, which explains the 80,32% role fit.
Ball progression
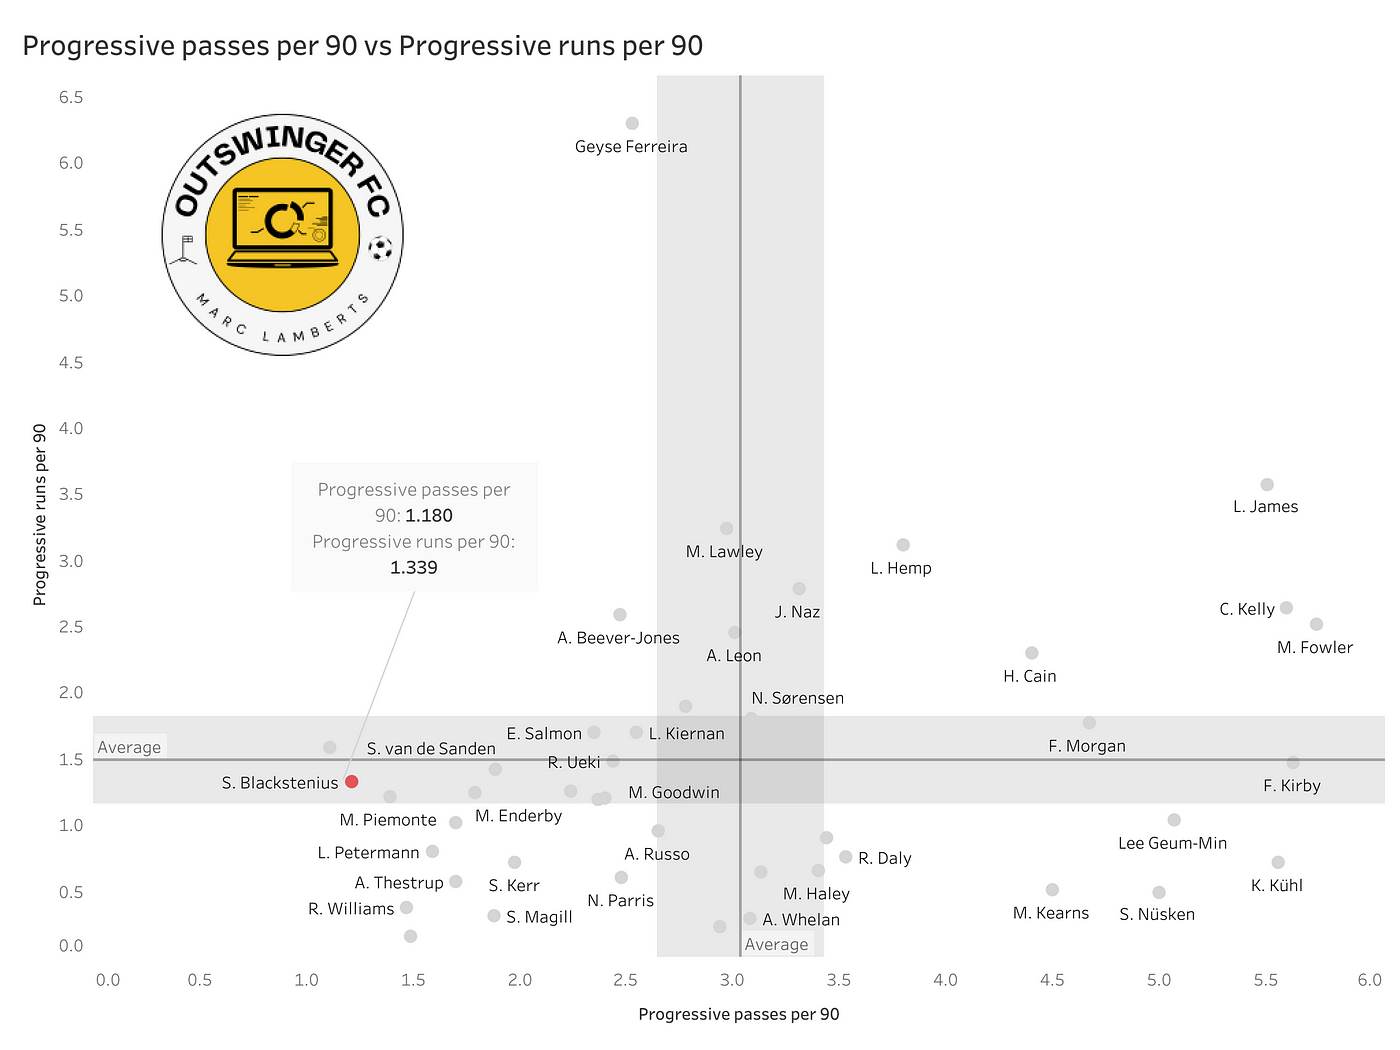
The modern striker isn’t only concerned with dribbling and crosses — but he/she also needs to be comfortable on the ball and progress play from it.
In the scatterplot above you can see the progressive metrics of progressive passes per 90 and progressive runs per 90. Blackstenius doesn’t do well here as she scores below average in the progressive passes metric, and below average in the progressive runs metric. Most strikers are doing better than her per 90 minutes.
Dribbling
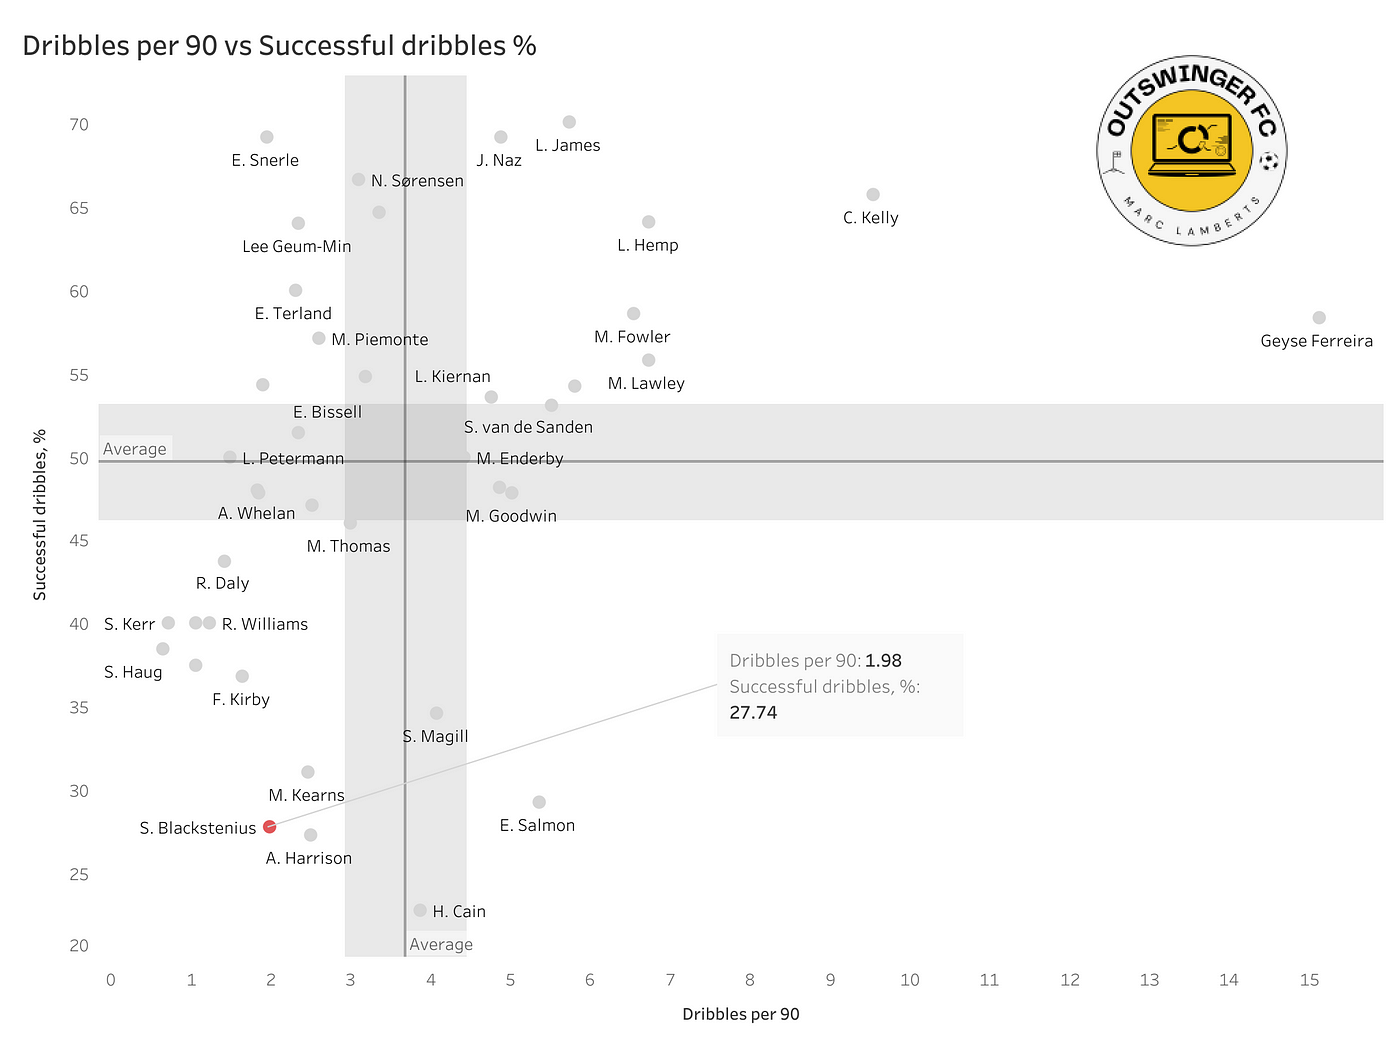
How good is Stina Blackstenius in her dribbling? Let’s find out in this scatterplot below:
In the scatterplot above you can see how well the player is scoring in terms of volume of dribbling and the success rate of those dribbles. As you can see Blackstenius heavily underperforms in both metrics again. But what does the context give us?
As you can see in the example above, Blackstenius struggles with the ball on her feet in relation to dribbling. Her close control isn’t as good that the defenders can be lost to her advantage. In fact, the defenders have the advantage over her and therefore her success rate is also significantly lower than some of her peers.
Key passing
Every player makes passes in a game, but which passes actively contribute to the progression and construction of an attack? You can see that in the bar graph below regarding key passes
As you can see in the graph above, Blackstenius scores very low in comparison to her peers in terms of key passing. If we look more closely she only is on average for key passes, through passes and deep completions. Despite not scoring high. the intent of her through passes does tell a lot about how she can help in an attack.
Blackstenius has a good technique to pass the ball and that also can be seen in the way she conducts her key passes, through passes in particular. She positions herself well, but there’s one thing that she really can work and it’s to give the right pace and weight on the passes. That will be the key to success.
In the video above you can see all the goals scored by Stina Blackstenius with Arsenal in the 2023–2024 WSL season.
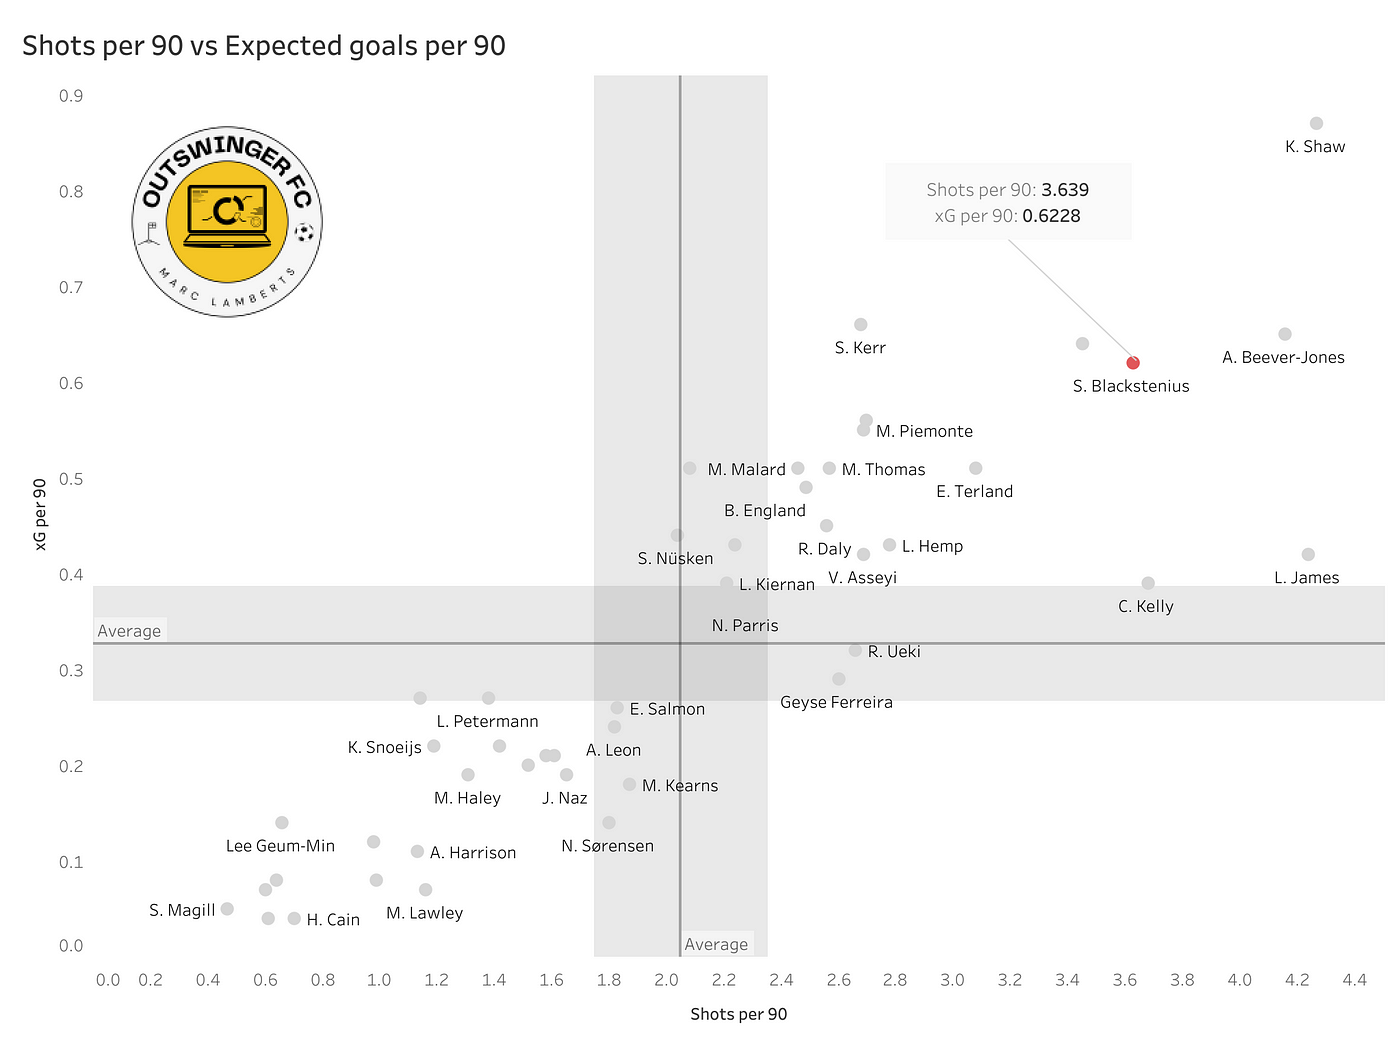
In the scatterplot above you can see the metrics of shots per 90 and expected goals per 90 combined. As you can Blackstenius scores above average for both metrics, with only Beever-Jones, James, Kelly and Shaw scoring better in the volume of shots and the xG generated, only Kerr, Russo, Beever-Jones and Shaw perform better.
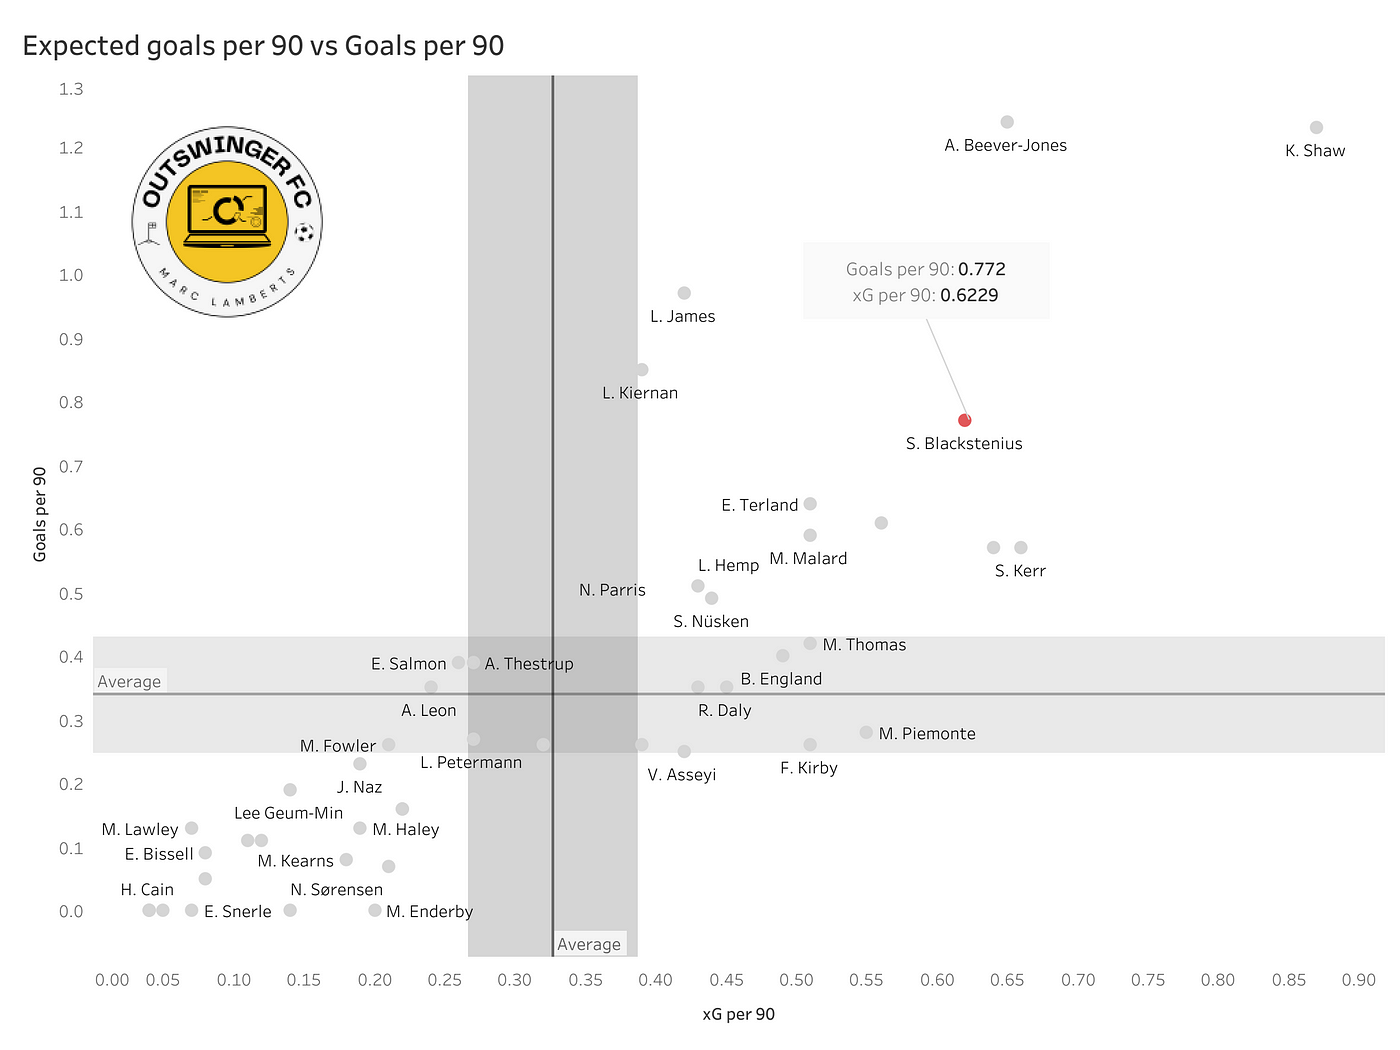
When we look at the expected goals and the actual goals we see that she averages 0,62 xG per 90 and 0,77 goals per 90 — this means that she is overperforming on her xG.
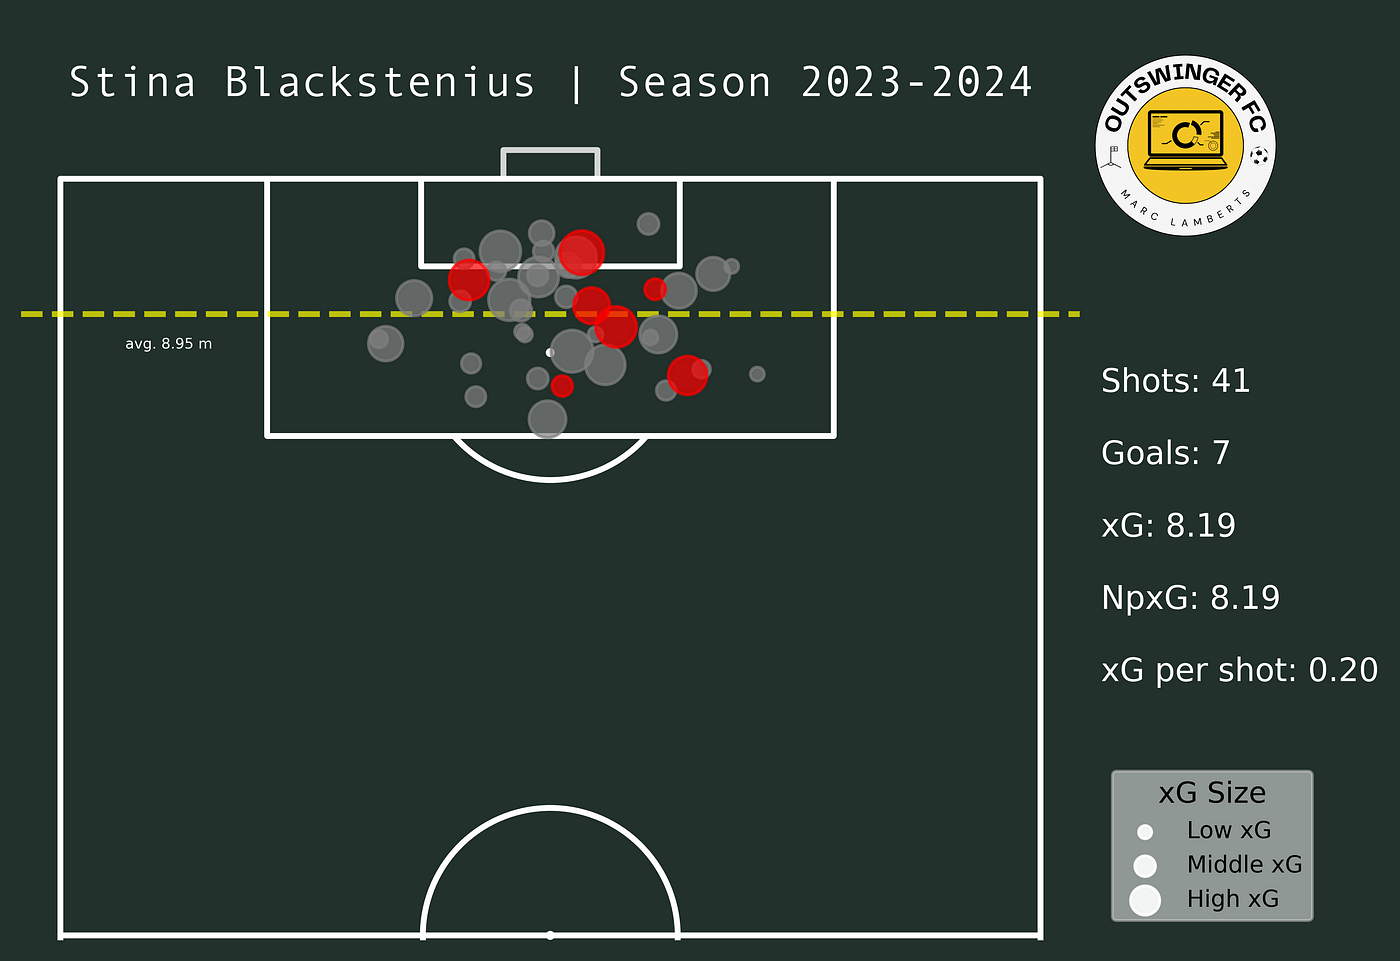
Blackstenius does sometimes come in the position to shoot, but how does he do in the quality of shooting?
In the shot map above you can see from where Blackstenius has conducted her shots in the 2023/2024 WSL season. She had 41 shots of which 7went in goal. 34,1% of her shots were on target and she generated a total xG of 8,19 — the latter meaning that she is overperforming with +1,19.
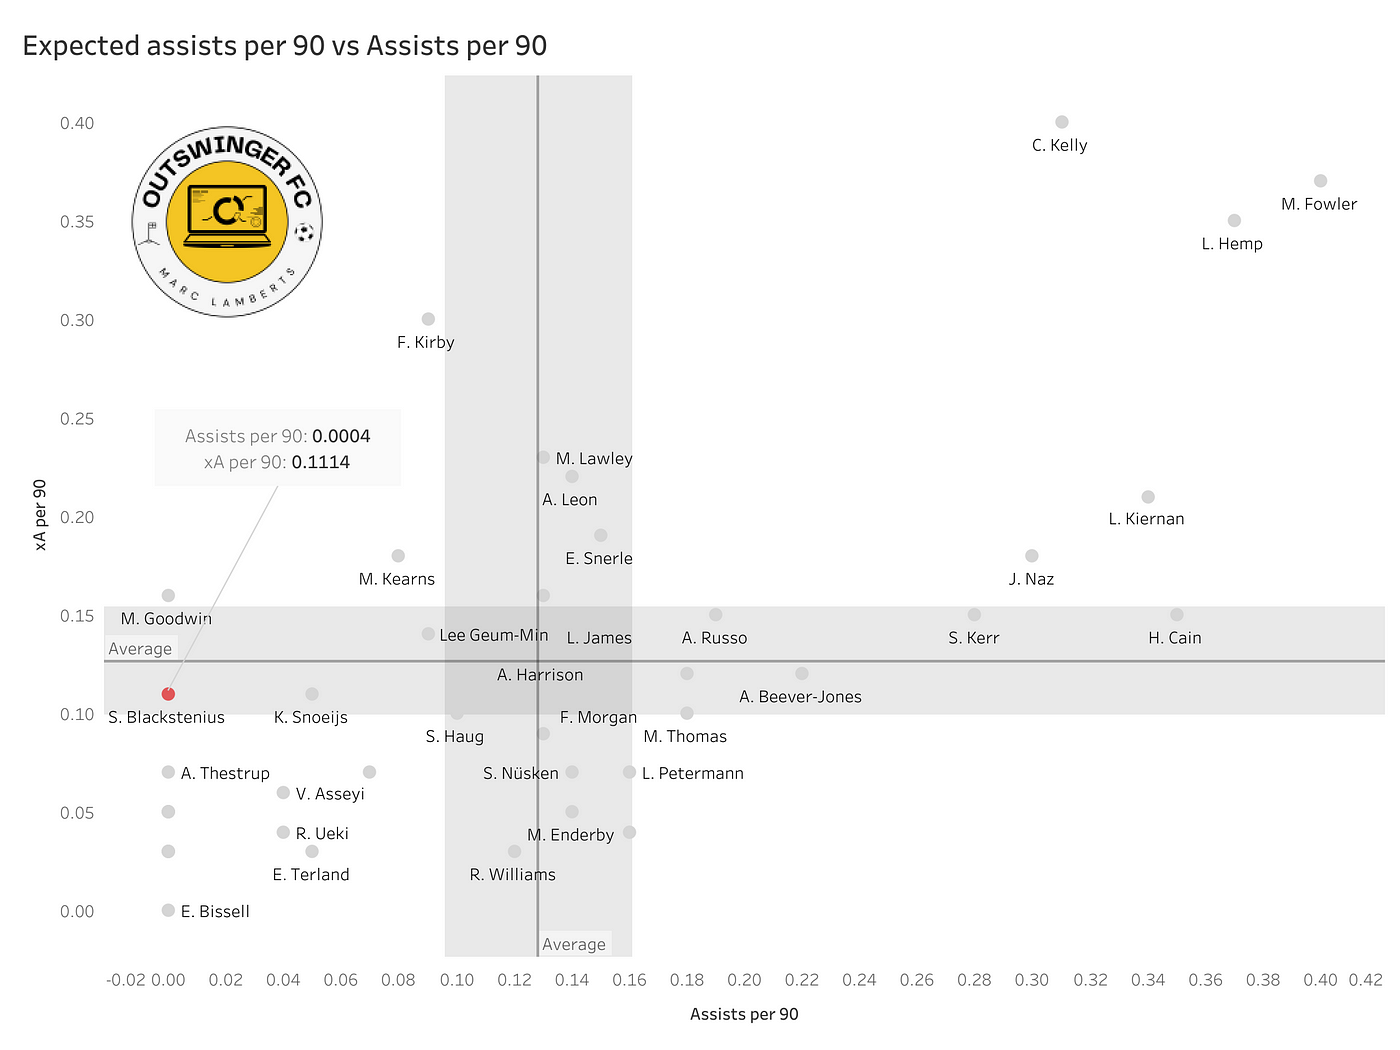
In the video above you can see her latest assists over two seasons with the Swedish National Team and with Arsenal.
As you can see she has an expected assists number of 0,11 per 90 and while others do score better on that front, she has an actual assist number of 0,0004 per 90 — which means he is underperforming quite significantly per 90 minutes.
Expected goal contributions
If we look at the expected goal contributions per 90 minutes we can see something very interesting. Blackstenius is expected to contribute to roughly 0,73 goals per 90 minutes. The emphasis for this, however, is on her finishing — as she isn’t doing well in the creating part.
Comparisons
Final thoughts
Stina Blackstenius was a bit of a mystery to me as I didn’t know how to rate her in terms of her performance. When we look more closely to the data we can see that’s a world-class striker of the ball and is top in the shooting metrics. In the ball progression and creation metrics, she scores below average in comparison to her peers.
In conclusion, we can state that Blackstenius is that pure number 9 and that Arsenal need to work with her in that regard.
The Eredivisie. The Dutch top tier has been either creating or developing talent, that later go on to play in the top 5 leagues in Europe. Obviously, there are many examples of these success stories, for Dutch plays and foreign players, but that’s not exactly what I’m writing about in this piece. I want to have a closer look at PSV golden boy: Cody Gakpo.
PSV has a history with exciting talent up front, with the most talented players being Memphis (Barcelona) and Bergwijn (Tottenham Hotspurs). It’s not unlikely that Cody Gakpo will be the next export product that will impress people abroad. Now, he has signed a new contract just a few days ago – but that doesn’t mean that come summer, the big boys in Europe won’t be waving with their bags of Euros.
Biography
Cody Gakpo was born on May 7th, 1999 in Eindhoven and is a local boy. The 22-year old attacker can play as a winger, as well as the striker, but he is at his best when he plays on the left flank and can invert. After which he uses his right foot to dictate play and choose a corner of the goal to shoot.
He started to play for EVV Eindhoven AV before starting in the PSV academy in 2007 until 2018. In 2018 he made the step from the academy to the first team and hasn’t been out of the picture since.
Data
In this article, I will use data, which comes from different sources. Most of the data comes from Wyscout and some will be from Soccerment. In my database from Wyscout I have included every player that is either a winger or a striker and they are from the following leagues: Eredivisie (NL), Jupiler Pro League (BE), Bundesliga (AUT), Primeira Liga (POR) & Premiership (SCO). I have selected all these leagues, as they have a similar range of quality.
There are 270 players in my database and they have been selected through their minimal amount of minutes played in the domestic league they play in. The minimum amount of minutes is 600. Normally I would pick 900 minutes as the benchmark, but since the season is still ongoing, I decided 600 was sufficient.
In the radar plot above you can see how Cody Gakpo scores in relation to the average of his peers in the leagues mentioned. He scores way above average in every single metric, except the head goals per 90 metrics. It’s fair to say that not many excel at head goals, but he hasn’t scored with his head – so that’s something he might need to work on.
So we have already seen that he does well above average, but how does he rank in the percentiles? In the image above you can see in which percentile he ranks for every attacking metric that we chose to look at it. In most of the metrics, he scores in the 80th percentile or up.
Shooting
In the image above you can see a scatterplot that contains two different metrics: shots per 90 and expected goals per 90. As you can see Gakpo does very well in the volume of shots. With his 3,51 shots per 90 he sits in the 96th percentile of all players in this database.
When we look to the other metrics, the expected goals per 90, we see that he does well – he is in the Q1 quarter, but not exceptional. With his 0,41 xG per 90, he sits in the 76th percentile. That’s good, but not exceptional.
As you can see I have marked Gakpo in green, and some Ajax players in red. I wanted to illustrate how well he does against their direct rivals for the title. Only Haller is way better, but his data is quite insane this season.
In the image above you can see a shot map of Cody Gakpo in the Eredivisie so far this season. In 14 games played he had a total of 45 shots in the Eredivisie, averaging 3,2 shots per game. Of those shots, he has scored 6 goals, which is a conversion rate of 13,33% according to Opta stats. According to Wyscout, he has an xG of 5,62 from 48 shots – which means he is overperforming his expected goals slightly with +0,38.
Creating
In the image above you see how good Gakpo is in the creating of direct goalscoring. We measure this in this article as expected assists 90 vs assists per 90. In the expected assists per 90, Gakpo has 0,38 xA per and sits in the 99th percentile.
When we look at the actual assists given per 90, we see that Gakpo does extremely well. He has 0,66 assists per 90 and sits in the 99th percentile for doing so.
As you can see I have marked Gakpo in green, and some Ajax players in red. I wanted to illustrate how well he does against their direct rivals for the title. Only Tadicy is way better, but his assist data is quite unique.
In the image above I have illustrated how well Gakpo does in the expected threat (xT) metric in this season’s Eredivisie. Before I look further into this, this is what xT is:
The basic idea behind xT is to divide the pitch into a grid, with each cell assigned a probability of an action initiated there to result in a goal in the next N actions. This approach allows us to value not only parts of the pitch from which scoring directly is more likely, but also those from which an assist is most likely to happen. Actions that move the ball, such as passes and dribbles (also referred to as ball carries), can then be valued based solely on their start and end points, by taking the difference in xT between the start and end cell. In the case of Grealish, his ball carry brought a 0.013 xT increase, and the pass added a further 0.26 xT. In short, he moved the ball from a low-xT cell (0.02 xT) to a much more dangerous area of the pitch (0.32 xT). Note that the xT action value can be negative for passes and carries that move the ball away from goal. – Soccerments
In short, how much does Gakpo contribute to the expected threat of a sequence of actions towards goal? If we look at the top 10 players of this season we see that Gakpo scores 8th. When we look at the expected threats by carries, we can see that he ranks second with 1,24 xT just after Elayis Tavsan with 1,35 xT.
Dribbling
In the image above you see how good Gakpo is in the dribbling metrics. We measure this in this article as progressive runs per 90 vs dribbles per 90. In the progressive runs per 90, Gakpo has 2,93 progressive runs per 90 and sits in the 90th percentile.
When we look at the dribbles per 90, we see that Gakpo does extremely well. He has 8,56 dribbles per 90 and sits in the 97th percentile for doing so.
As you can see I have marked Gakpo in green, and some Ajax players in red. I wanted to illustrate how well he does against their direct rivals for the title. Only Anthony is slightly better, but Gakpo comes close to his numbers.
Final thoughts
When we look at the data for shooting, creating and dribbling – it’s evident that Cody Gakpo is an exciting player. He scores in the highest percentile for most of the metrics, and compared to 270 of his peers, he does extremely well. The next step is to see whether he fits the profile of an attacker needed by one of the big clubs, by looking at his videos.
With Owen Wijndal leaving AZ in 2022, it was a big question of who would step up to the plate and make an impact for AZ, as they were continuing to develop. And someone did: Milos Kerkez became a sensation both in the Eredivisie and in the Conference League. This saw him getting his transfer to AFC Bournemouth.
In this article, I analyse his performances in the 2022/2023 Eredivisie where I focus on data and video. The data and video has been collected on July 25th, 2023, and comes from Wyscout. The event data comes from Opta.
Previous clubs: Rapid Wien(Y), Hodmez (Y), Gyor (Y), Milan (Y), AZ
International: Hungary (8 games)
Kerkez is a very attacking-minded full-back who played on the left side for AZ Alkmaar in the Eredivisie. He loves to progress in the wide areas and interact with both the winger and the strikers, in order to create more goalscoring threats through his progression on the ball.
He has a good ball-striking ability and always tries to come in a situation to either provide a key pass or shoot himself. His crosses are of a high quality and that has provided fruitful, as he was often involved in the attacking phases of the game.
In terms of defending, he definitely needs to learn more. Especially, now he went to Bournemouth and isn’t one of the dominant teams — he will need to improve in defensive action and defensive cover.
The data visuals and video below will show what Kerkez is capable of.
Seasonal stats
Milos Kerkez — Defensive data profile
In the image above you can see the percentile rank radar of Milos Kerkez and the distribution, based on his defensive data profile. This is in comparison with his peers during the Eredivisie season in the same position. He scores in the high average on most metrics, but as you can see he needs to work on his progressive passing, his interceptions, and his shot-blocking.
Milos Kerkez — Attacking data profile
In the images above you can see the attacking data profile of Milos Kerkez compared to his peers in the Eredivisie. As you can see he scores high in successful dribbles, touches in the box, aerial wins, non-penalty goals, and expected goals. This gives an indication that Kerkez is a very attacking-minded left-back and that his key qualities lie in that area.
This data does explain a bit about his overall scores in comparison to his peers, but how and where does he make these actions? I will attempt to illustrate that below.
Defensive actions
Kerkez seems to be doing not so great in the defensive metrics compared to his peers, but he does have defensive actions of course. So where does he conduct these defensive actions?
In the visual above you can see where Kerkez conducts his defensive actions, and we can see that his ball recoveries and interceptions are mostly on the own half with a tendency to go into the half-spaces. His tackles, however, are wider and focused close to the line and are spread out more in the defensive third, and middle third.
So how high does he score when looking at the defenders in the league? You can see that in the scatterplot below.
But how does he defend? We have seen where he defends, but what do successful defensive actions look like?
In the video above you see a compilation of his defensive actions with AZ in several games against top sides. They showcase his ball recovering ability, and how complex (or not) these are.
Ball progression
The modern fullback isn’t only concerned with defending and producing defensive actions — but he/she also needs to be comfortable on the ball and progress play from it.
In the scatterplot above you can see the progressive metrics of progressive passes per 90 and progressive runs per 90. Kerkez does pretty well here as he scores above average in progressive runs, but under average in progressive passes per 90.
Ball progression can have via different aspects of the game, but I wanted to look at his abilities on the long ball. He can use it to connect with the attacking third or to get out the press of the opposition.
Kerkez uses these balls to progress the play, sometimes to beat the press and sometimes just as a link-up option, but he uses the long balls to progress play on the same flanks.
Key passes
Every player makes passes in a game, but which passes actively contribute to the progression and construction of an attack? You can see some of these metrics in the beeswarmplot below.
As you can see in the graph above, Kerkez scores high in most metrics, and this is compared to all players in the Eredivisie with at least 900 minutes played. Especially his key passes per 90 and the passes to the penalty area per 90.
What’s interesting is how he makes through passes. He scores in the high average, but the intent of his through passes does tell a lot about how he can help in an attack.
Kerkez is known to get forward a lot and into the wide areas of the final third. He is quick, agile, and knows how to beat his direct opponent in a 1v1, but also carries the ball into the half-space to orchestrate play from there.
Shooting
In the shot map above you can see where Kerkez has conducted his shots in the 2022/2023 Eredivisie season. He had 25 shots of which 3 went in goal. He generated a total xG of 2,52 — the latter meaning that he is overperforming with +0,48.
Apart from shooting in the box, he loves to shoot from zone 14 and left from that zone — as that is the zone where comes frequently and tries to shoot from a distance. But most shots come from inside the penalty area, just like where he scored his goals.
Final thoughts
In this data-heavy article, we have looked at some of his key qualities on the ball and it’s quite evident that he was one of the best in the Eredivisie when it comes to how he attacks. His passing game and attacking tendencies were one of the best, but his defensive qualities in terms of tackling, ball recovering, and interceptions — can definitely be improved. If he does that, he might be a successful player on Premier League level.
Tijjani Reijnders has been of the revelations of the Eredivisie 22/23 season and as one the best players too. The AZ midfielder has shown how well he can do in a strong AZ team, that performed great at times — both domestically as also in the Conference League.
There have been rumors and everything but confirmation that the midfielder will sign with Milan in Serie A.
We will use data to illustrate how Reijnders has done in the Eredivisie 2022/2023 and we will focus on the winger position on the right flank. It’s interesting to look into this profile, as he is quite particular in his attacking actions.
Contents
Biography
Seasonal stats
Positions/roles
Defensive actions
Ball progression
Dribbling
Key passing
Assisting
Shooting
Final thoughts
Biography
Name: Tijjani Reijnders
Date of birth: 29–07–1998
Nationality: Dutch
Position: Central midfielder, defensive midfielder
Contract expires: 30–07–2026
Current club: AZ (close to signing for Milan)
Previous clubs: PEC Zwolle (Y), FC Twente (Y), CSV’ 28 (Y), PEC Zwolle (Y), AZ (Y), RKC Waalwijk (L), AZ
Current international: Netherlands U21
Tijjani Reijnders’ versatility is one of his most notable traits. He is primarily a midfielder but has the versatility to play in a number of midfield positions, including as an attacking winger. This versatility not only demonstrates his adaptability but also makes him an asset to any team because he can successfully contribute to various playing styles and tactical setups.
Because of his exceptional technical skill, Reijnders is highly regarded. He can control the pace of the game from midfield thanks to his exceptional ball control, dribbling, and passing abilities. He is a creative force on the field because of his adept ball distribution and capacity to pierce defenses with incisive through passes.
Furthermore, he can easily evade opponents thanks to his close ball control, which enables him to move through confined spaces. Tijjani Reijnders has exceptional vision and football intelligence. He has an innate awareness that allows him to anticipate moves and make wise choices on the field.
Season stats
In the visuals above you see how Reijnders performs against peers in the defensive midfield during the Eredivisie season. It focuses on the attacking abilities of the player and what we can see in the percentile ranks and distribution is that the scores high on progressive carries, accelerations, shots, smart passes, second assists, assists and expected assists. Also his cross completion and short passes, he scores high in comparison to his peers.
In the visuals above we see the defensive profile of Reijnders in comparison with his peers. He stands out in the passing and ball progression metrics, but not so much in the more defensive metrics. This indicates that he is a more of deep-lying playmaker or central midfielder over a defensive midfielder, even if he plays this specific position.
Roles
There are three different data profile roles I’ve looked at in midfield. Box-to-box midfielder role, deep-lying playmaker role and the attacking playmaker role. Below we will look at how Reijnders fits those profile compared to all midfielders in the Eredivisie.
When we look at the sample of 128 players, we find that the fit for the role of box-to-box midfielder is quiet high. From the top 10 fits in this role, Reijnders scores third with 97,7% just after Zerrouki and Gutiérrez.
In terms of the deep-lying playmaker role, Reijnders scores 88,22% fit. That’s the 20th on the list above, which means he still a very good fit — but perhaps not his best fit.
In terms of the attacking playmaker role or the “number 10” role, Reijnders scores in the top with a role fit of 94,78%. This is his second best role after the box-to-box role.
Defensive actions
Reijnders is a defensive midfielder or did play in that position a lot, so his defensive actions are very important and we have seen he doesn’t score the highest. Nevertheless, they are still important.
So where does he conduct these defensive actions?
As you can see Reijnders does recover many balls in the defensive and middle third ot the pitch, especially in the central zones. In terms of reactive defending — meaning tackling — he does that in the middle third in the right half-space. He is more productive and proficient in the proactive defending area, as we can see in the volume and locations of the interceptions.
So how high does he score when looking at the defensive midfielders in the league? You can see that in the scatterplot below.
If we look at the scatterplot above and we see the sliding tackles vs interceptions, indicating reactive vs proactive defensive actions. In both the metrics Reijnders scores above average with 0,56 sliding tackles and 5,09 interceptions. , but it’s safe to say he is not a big performer in these metrics and this isn’t one of his strongest areas.
In the video above you see a compilation of his defensive actions with AZ in several games. They highlight his ball-recovering ability, his strength in defensive duels and in defensive awareness of Reijnders.
Ball progression
The modern defensive midfielder isn’t only concerned with defending and producing defensive actions — but he/she also needs to be comfortable on the ball and progress play from it.
In the scatterplot above you can see the progressive metrics of progressive passes per 90 and progressive runs per 90. Reijnders does pretty well here as he scores above average in progressive runs, but slightly under average in progressive passes per 90.
Ball progression can have via different aspects of the game, but I wanted to look at his abilities on the long ball. He can use it to connect with the attacking third or to get out the press of the opposition.
In doing so, Reijnders not only proves his defensive worth — but also manages to show the worth he has in terms of the progression of the attack and connecting the defensive lines to the attacking third.
Dribbling
In the visual above you can see the metrics of dribbles per 90 and the successful dribbles in %. What you can you see is that compared to all players with 900 minutes, Reijnders scores above average in both metrics and is largely surrounded by attackers.
Key passing
Every player makes passes in a game, but which passes actively contribute to the progression and construction of an attack? You can see some of these metrics in the beeswarmplot below.
As you can see in the graph above, Reijnders scores high in most metrics, and this is compared to all players in the Eredivisie with at least 900 minutes played.
What’s interesting is how he makes through passes. He scores in the high average, but the intent of his through passes does tell a lot about how he can help in an attack.
When Reijnders comes higher up the pitch, he can be the player with the through pass that is a pre-assist/second assist. He opens up the play with his through passes.
Assisting
In the visual above you can see the metrics of expected assists and assists compared.
Reijnders scores above average in both metrics with 0,2 expected assists per 90 and 0,15 assists per 90, meaning that he is slightly underperforming his assists per 90 minutes, but still quite close.
Reijnders does come in the position to shoot, but how does he do in the quality of shooting?
In the visual above you can see the metrics of expected goals and goals compared.
Reijnders scores above average in both metrics with 0,15 expected goals per 90 and 0,11 goals per 90, meaning that he is slightly underperforming his assists per 90 minutes, but still quite close.
Tijjani Reijnders is a highly skilled midfielder who can play in defensive midfield, but also in central midfield. His defensive qualities aren’t the best for a defensive midfielder, but on the ball he is one of the best players in the league with his passing vision and football intelligence.
It’s happening. Victoria Pelova, arguably the Eredivisie Vrouwen’s best player, is getting her move to the WSL in England. It’s reported that the young attacking player will sign for North London side Arsenal and will become needed in the attacking ranks.
But what kind of player is Pelova really? The general public might not know her and if they do know her, it’s from the Dutch national team or the games in UWCL qualification against Eintracht Frankfurt and Arsenal. It’s hard to assess her performances due to the lack of Eredivisie Vrouwen games available, but in this scout report, we will look more closely at her (limited) data and video.
CONTENTS
Biography
Seasonal stats
Positions/roles
Dribbling
Key passing
Shooting
Assisting
Final thoughts
BIOGRAPHY
Name: Victoria Pelova
Date of birth: 03–06–1999
Nationality: Dutch
Position: Attacking midfielder, winger
Contract expires: 30–6–2023
Current club: Ajax
Previous clubs: ADO Den Haag
International: Netherlands
SEASONAL STATS
The Eredivisie is still underway and it’s for 50% played at this point, but we can have a look at some interesting statistics in front of goal for Pelova. Pelova plays for Ajax and the Amsterdam formation is ranked 2nd with 27 points from 10 games, only losing to league leaders FC Twente. They have scored 38 goals and conceded 7, meaning that they have a positive goal difference of +31.
In the image above you can see the top 15 performers in the Eredivisie with goals. As you can see Pelova scores 14th with 3 goals and isn’t a major goalscoring player.
In the image above you can see the top 15 performers in the data metric of assists. You can see that Pelova, again, is not a top performer — being 13th on assists. Combined with her goals she has contributed to 5 goals, which isn’t a lot but also isn’t too few. Especially considering she played mostly from the #10 role, rather than in attack.
POSITIONS/ROLES
Pelova is a relatively versatile player, but also a hybrid player. She can play on different positions and assume different roles.
As you can see in the image above, I’ve chosen for a 4–3–3 formation to illustrate where she can play the best. She isn’t very well suited to play as a striker in most systems, she will be dominated quite easily. The role of a false 9 could suit her better, but still not a desired position/role.
The wings are better suited. While the left is not the best for Pelova, the right win is something she can excel in. Relating to Arsenal, that would be the position where she might feature the most. She is not a typical wingers in the classic sense, but more a wide playmaker who loves to invert and play from the half-spaces.
With Ajax she often played on the #10 position as a creator with dribbling tendencies. In this role she could orchestrate attack and launch her teammates, as well as make an action herself.
DRIBBLING
The first aspect we are focusing on is the metric of dribbling. Dribbling is very important for a winger and attacking midfielder, and it’s important to assess how good Pelova is in this regard.
Pelova has a natural drift to accelerate with the ball. She is strong on the ball, keeps the ball close to her body and switch easily between angles and sides. Her style of dribbling attracts multiple defenders because her technique is good, and therefore also opening up space for runs of defenders and/or midfielders.
In doing so, she can make sure the team drift towards the final phases of the pitch and generate overloads, because how good she is with the ball. A few things about her dribbling though; she has her limitations with it. Because she is technically gifted and better than most, she will sometimes go too far with her dribbling and run into a wall. The transition following that can leave her team vulnerable. Especially when she plays as a 10, she needs to be conservative and pass the ball earlier — to prevent high risk turnovers.
KEY PASSING
In the video above you can see the key passing as conducted by Pelova. Through her positioning she always gets in the right positions to execute passes. She uses the momentum to keep the ball and at the same moment allows her teammates to get into better positions.
By doing this she has more specific passing options which she can utilise by her passing technique. She can do this with set pieces, through passes or crosses. If she plays as a winger or on the 10 position, she can really be pivotal in central areas or in the half spaces.
SHOOTING
In the video above you can see Pelova’s shots in the games with Ajax against quality opposition. What’s interesting is that the player often comes in the positions that she has enough time to shoot – as you can see in the video, but doesn’t convert those chances most of the time.
This can be explained due to the fact that she is more of a creator than a finisher, but also her finishing abilities really need an upgrade does she want to be more clinical on the finishing aspect of her game. Especially in comparison with her playmaking skills. What’s very positive about her play is that she always comes in the position to shoot, so when she works on her finishing, she will be unstoppable.
ASSISTS
In the video above you can see the assists given by Pelova in her Ajax time and also with the Dutch national team. What’s prominent in her play is that she is really good at creating high quality chances for her attackers, which can be seen in the video.
Outside of assisting, she manages to get the ball – make a dribble and look for the best options. Because she isn’t overly selfish as a winger or attacking midfielder, she often knows what’s needed to get that decisive pass or cross. If the attackers she plays with, understand her even better, she will score higher and higher in the assist rankings.
FINAL THOUGHTS
Victoria Pelova is not your typical winger. She is more a playmaker than a traditional winger. She likes to dribble down the line and provides crosses, but more than that she likes to go into the half spaces and orchestrate attacks from there. I would say she is even better at #10 role because of it, but in the winger role she will invert and create from the half-space and open up space for midfielders to run into.
Her qualities can be seen in her vision, attacking positioning and her eye for a good decisive pass. She needs to work on her finishing, but she has great potential.
The world of women’s football has been growing a lot in the last decade, but we can see another innovative progression after the Euro 2022 in England. We are now at a crossroads in women’s football where investment is growing all across the board, which also means that the margins are becoming smaller and details are much more important.
This is also the case in the world of analysis. How do we make sure that our players/teams/leagues have that edge over the competition? It means analysis in the margins and that also means looking at theoretical concepts and the practical outcome. I wanted to do this whilst looking at the NWSL in the United States in the 2022 season.
The metric I have chosen is goals added (G+) and the player I have chosen for this case study is Sophia Smith. Smith is an exciting talent and it would be interesting to me to see how she does in this specific metric that adds value to each action in terms of the ultimate goal: scoring goals.
DATA
This is a data analysis of Sophia Smith’s season in the 2022 NWSL, but it also focuses on the overall performances of players in terms of goals added. The database contains all players with minutes in the 2022 NWSL season with an emphasis on attacking and creative players.
The data was collected on November 14th 2022 and has been collected from American Soccer Analysis, who have calculated their own data in terms of expected goals, expected passing and goals added — the latter is what we will focus on.
SOPHIA SMITH
Name: Sophia Smith
Date of birth: 10–08–2000
Nationality: American
Position: Attacker
Current club: Portland Thorns
Previous clubs: Stanford (Y)
International: United States(27 games)
Sophia Smith was drafted in the first round of the 2020 NWSL draft and has played for Stanford before. In Portland, she has grown into a full senior international in the US team, as well as a seasoned player in the NWSL. In 18 games in the 2022 NWSL season, she managed to score 14 goals and give 3 assists, meaning that she was involved in 1,31 goal contributing actions every 90 minutes.
She has been instrumental into Portland Thorns’ championship in 2022 and has scored many important goals in the process. In this analysis we want to find an answer to the question: how much value does she bring to the team and the league, by assigning values to her actions with the theory of goals added (G+).
GOALS ADDED
American Soccer Analysis created the goals added metric to assign values to each action into an attacking phase or defensive phase. They explain it like this on their website:
“Goals added (g+) measures a player’s total on-ball contribution in attack and defense. It does this by calculating how much each touch changes their team’s chances of scoring and conceding across two possessions.
For example, at the moment a player receives the ball at midfield, their team might have a 1.5% chance of scoring on that possession but also a 1% chance of conceding on the next possession. That situation isn’t very valuable. But if they play a throughball from there into the final third, their team is now in a much better situation and might have a 6% chance of scoring and only a 0.5% chance of conceding. The pass would be worth the difference in their team’s situation before and after it, or (0.060–0.005) — (0.015–0.010) = +0.050 goals added.
Goals added only looks at the likelihood of goals. It doesn’t give players any credit for actually scoring. So a striker will be rewarded for finding space to receive a pass in a good position and may earn some shot value for turning a possession into a shot on target, but that value won’t change depending on whether the goalkeeper saves the ball. This keeps the model from assigning too much importance to finishing, which statistically is almost random, and instead rewards actions that consistently lead to goals.”
If you want to read more about it, you can read it on the American Soccer Analysis website, here and here.
Goals added can both work in attacking sense as in defensive sense, but we will only focus on the attacking one. The reason why we have chosen for that is that we want to measure the value of the attacking actions of Sophia Smith in the chain of events toward the likelihood of scoring a goal.
Goals added can be divided into the following categories:
Shooting: how much does shooting contribute to goals added?
Receiving: how much does receiving the ball after a pass contribute to goals added in the whole chain?
Passing: how much does passing the ball (+receiver) contribute to goals added?
Dribbling: how much does dribbling, take-ons and carrying the ball contribute to goals added in attack?
Interrupting: how much do interceptions, tackles, blocks, clearances, recoveries, and contested headers contribute to goals added?
Fouls: fouls committed and received
These categories will feature in the data analysis and visualisation that will be done below.
ANALYSIS
Before delving into the actual analysis, it’s important to make sure that the database is representative of the quality and level of the league. A player with 900+ minutes will be more representative than someone with 50 minutes in the 2022 season. Our complete database consists of 286 players of which goals added is recorded/collected.
This means that we have made a cut-off in terms of minutes. We have made it the equivalent of 5+ games and decided to take 500 minutes played as the minimum. This means that our database shrinks from 286 players to 196 players who are eligible/representative for our research.
In this analysis we will first refer to the goals added (G+) in relation to the minutes played to show the representation. After that, we will refer to the specific aspect of goals added to the total goals added.
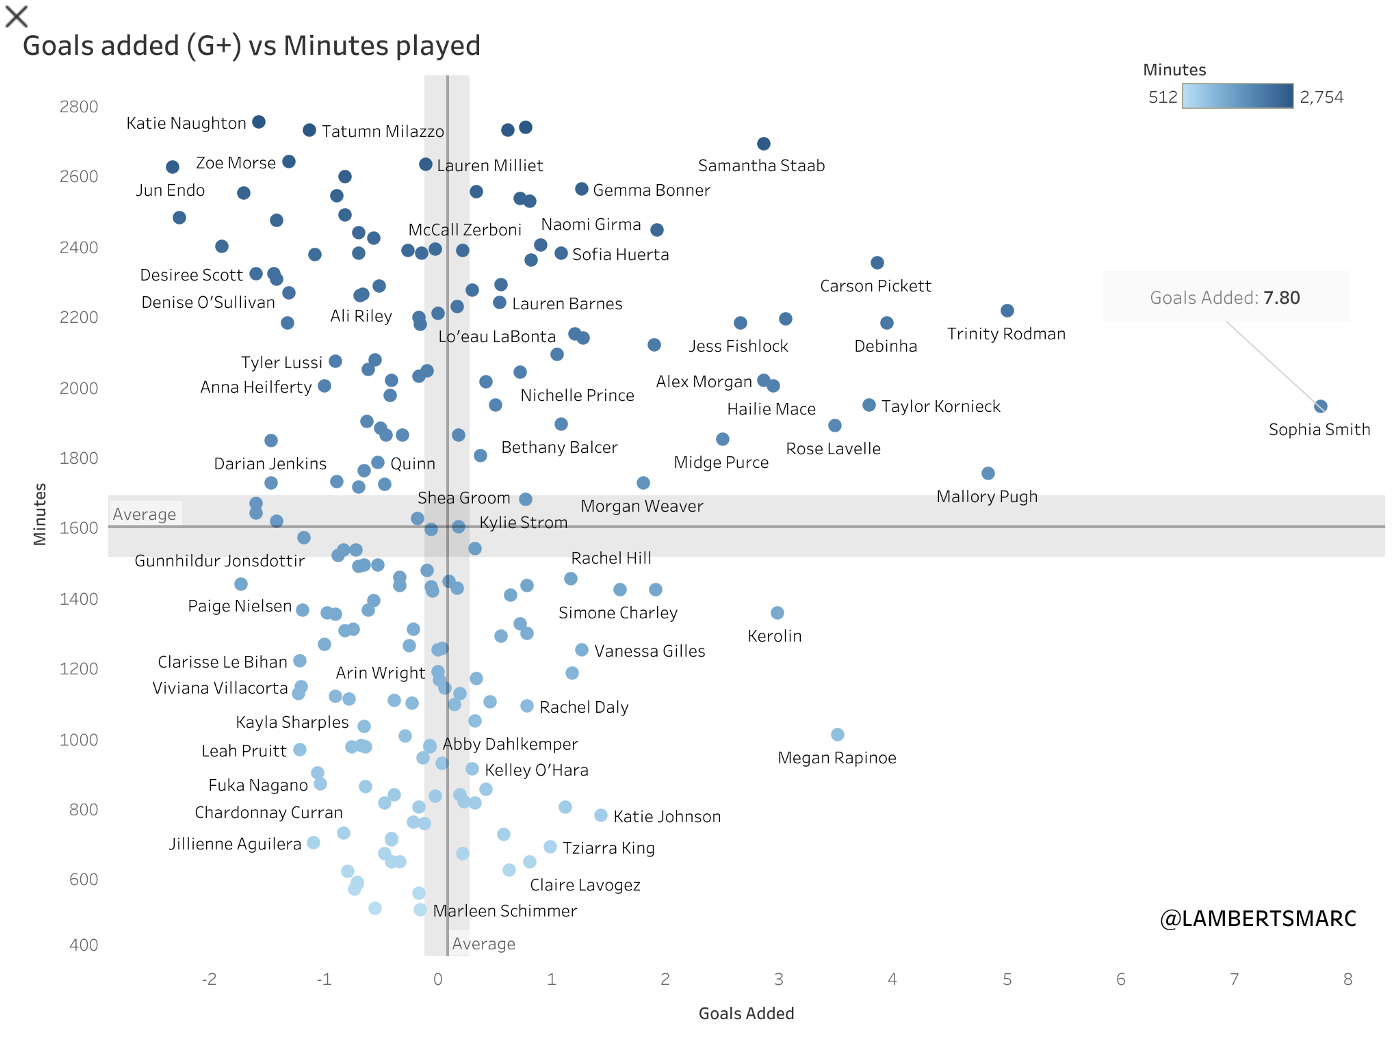
In the scatterplot above you can see the total of goals added in relation to the minutes played. The average minutes played are 1603 minutes and the average of goals added is 0,08 goals added.
With goals added we measure the actions that contribute to the likelihood of a goals scored, but it definitely looks at multiple actions in comparison to expected goals. If we look closer to Sophia Smits we can see she has above average minutes with 1945 minutes, but has the highest goals added of the whole NWSL in the 2022 season with 7,8 goals added over the whole season. What does this mean? In the whole season, her attacking actions have contributed to the likelihood of 7,8 goals being scored.
In the scatterplot above you can see the shooting (G+) in relation to the total of goals added. The average shooting (G+) is 0,02 and the average of goals added is 0,08 goals added.
Sophia Smith scores very high on the goals added metric as shown above, but she also is by far the best in accumulating shooting (G+) with 1,85 shooting (G+). The next player coming close to her is Alex Morgan with 1,18.
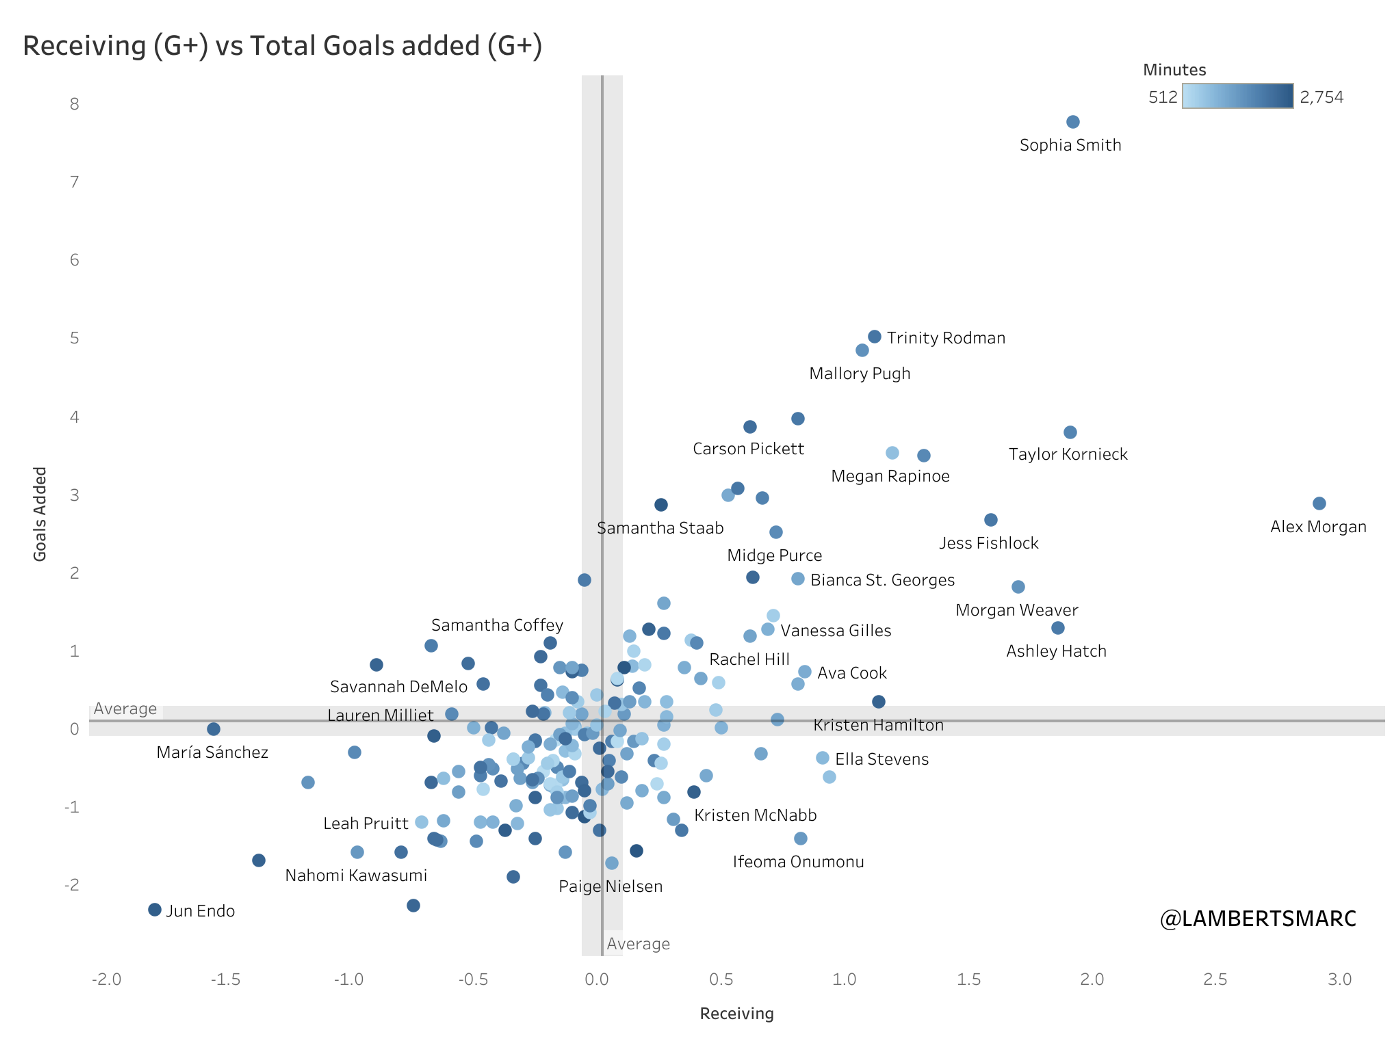
In the scatterplot above you can see the receiving (G+) in relation to the total of goals added. The average receiving (G+) is 0,02 and the average of goals added is 0,08 goals added.
Sophia Smith scores very high on the goals added metric as shown above, but she isn’t the best in the metrics of receiving (G+). She has 1,92 receiving G+, which is the second highest in the database after Alex Morgan. Taylor Kornieck (1,91) and Ashley Hatch (1,86) follow closely.
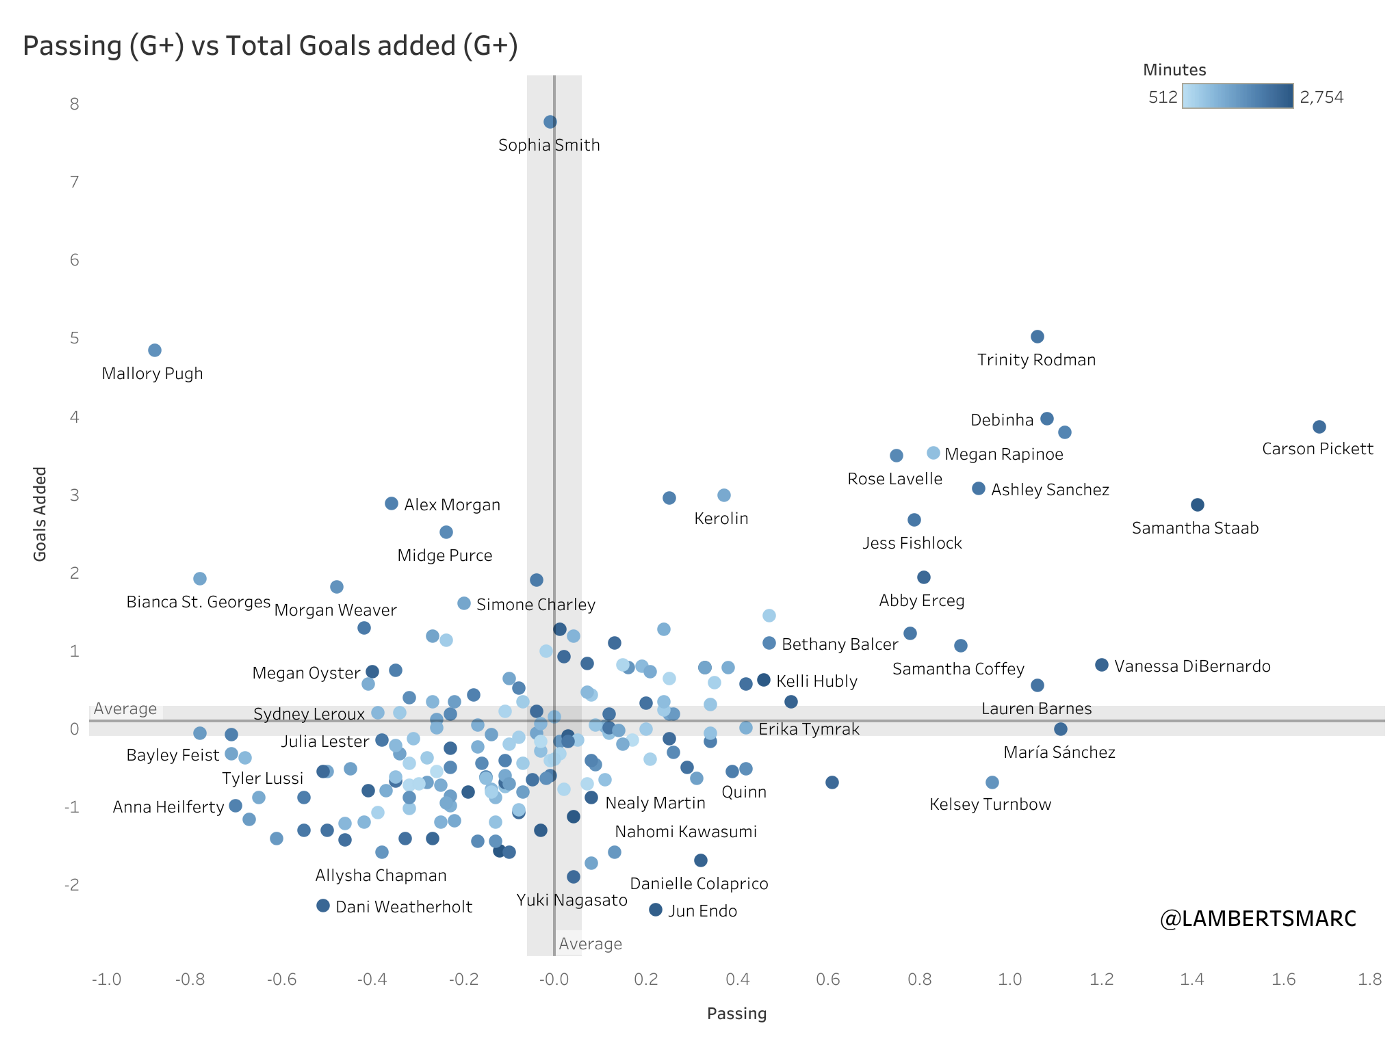
In the scatterplot above you can see the passing (G+) in relation to the total of goals added. The average passing (G+) is 0 and the average of goals added is 0,08 goals added.
Sophia Smith scores very high on the goals added metric as shown above, but she doesn’t score high in the passing (G+). In fact she scores below average with -0,01 and there are many players scoring higher than her on the passing (G+) in the 2022 NWSL season.
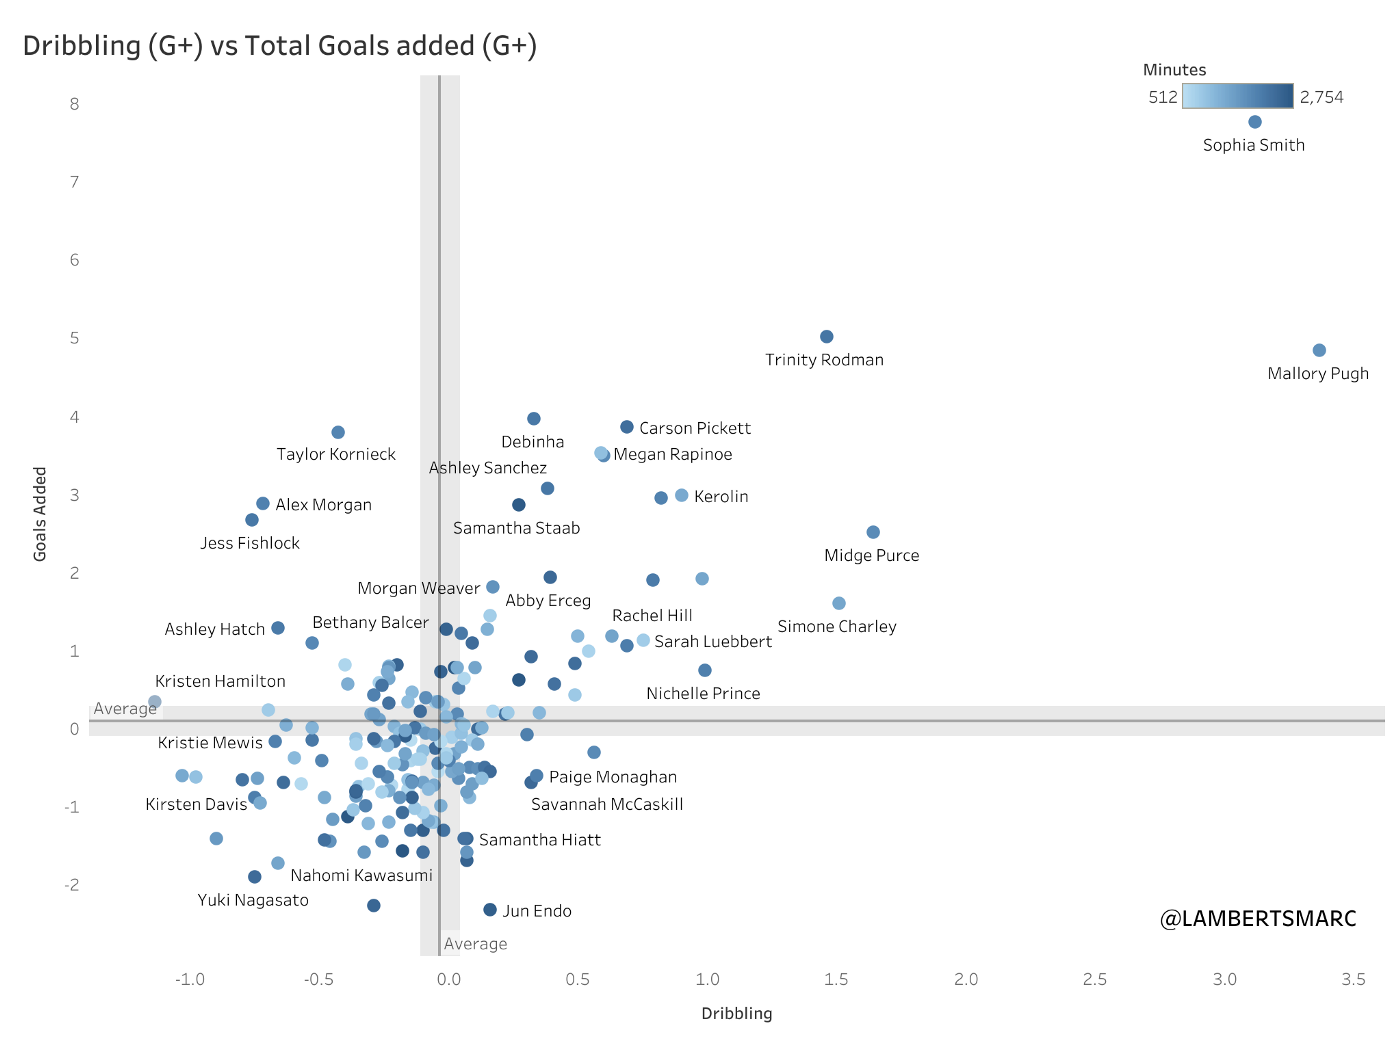
In the scatterplot above you can see the dribbling (G+) in relation to the total of goals added. The average dribbling (G+) is -0,04 and the average of goals added is 0,08 goals added.
Sophia Smith scores very high on the goals added metric as shown above, and she scores very high on the dribbling metric as well. She is second after Mallory Pugh, with 3,12 dribbling G+. The high number indicates that this is a significant part of her total goals added.
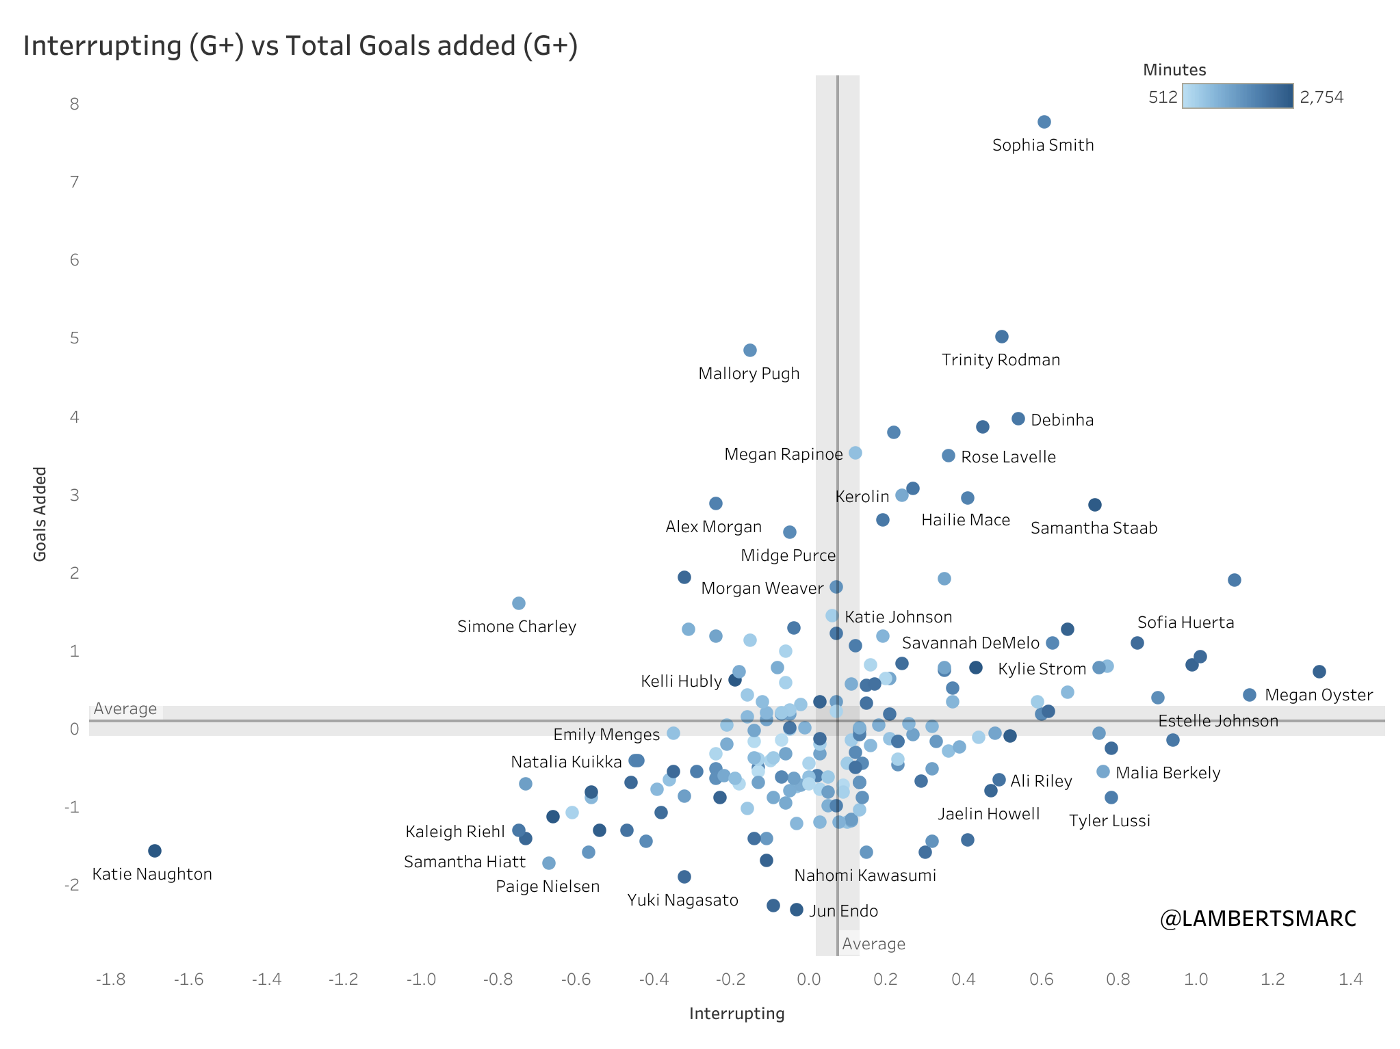
In the scatterplot above you can see the interrupting (G+) in relation to the total of goals added. The average interrupting (G+) is 0,08 and the average of goals added is 0,08 goals added.
Sophia Smith scores very high on the goals added metric as shown above, and she scores quite high on the interrupting (G+) as well with 0,61 interrupting G+. 20 players score higher than her, meaning that she is in the high average for this metric.
FINAL THOUGHTS
With goals added we can assign values to attacking actions within a chain of events for every player. We can see that Sophia Smith has 7,80 G+ in total, but these are mostly generated in shooting, receiving and dribbling. Passing isn’t as impactful and interrupting is in the high average.
From this information, we can say that her threat and contribution going forward, mostly come from her shots, where she receives passes, and her ability to dribble/carry the ball — which makes her one of the highest performers in these metrics. Overall, she scores highest with 7,80 G+ in the 2022 NWSL.
We have played 10 games in the Dutch Eredivisie in the 2022/2023 season. Perhaps it’s too early to talk about crucial performances and measuring quality depending on this season alone, but we can look closer to some players and how their first impression is in this season. One of the players I was anxious and excited to see, was Xavi Simons at PSV.
Under Ruud van Nistelrooij, Xavi Simons has been instrumental in their success in attack as well as providing creativity in the opposition’s half. It has been 10 games in the season, but next to the wonderful Gakpo, Simons has played a huge part in how PSV conduct their attacks.
We will use data and video to illustrate how Simons has done in the Eredivisie 2022/2023 so far and we will focus on the attacking positions.
CONTENTS
Biography
Seasonal stats
Ball progression
Key passing
Shooting
Assists
Final thoughts
Biography
EINDHOVEN, NETHERLANDS – SEPTEMBER 08: Xavi Simons of PSV Eindhoven in action during the UEFA Europa League group A match between PSV Eindhoven and FK Bodo/Glimt at Phillips Stadium on September 08, 2022 in Eindhoven, Netherlands. (Photo by Dean Mouhtaropoulos/Getty Images)
Name: Xavi Simons
Date of birth: 21–04–2003
Nationality: Dutch
Position: Attacking midfielders
Contract expires: 30–6–2027
Current club: PSV
Previous clubs: Barcelona (Y), PSG (Y), PSG
International: Netherlands U21 (2 games)
Xavi Simons is a wildly interesting player for PSV. Characterised as an midfielder with good on the ball abilities in passing and carrying, the young Dutch player also plays in the number 10 role or as a winger. Yesterday in the game against Arsenal we even saw him briefly as a striker. To make a long story short, he is a versatile attacking talent and is taking the Eredivisie by storm.
Seasonal stats
In the pizzaplot above you can see how Xavi Simons is performing against all midfielders in the 2022/2023 Eredivisie so far. This pizzaplot doesn’t give us a definitive judgment on how he performs, but gives us a stylistic overview of his data profile.
We will go into details for the specific stats later for the absolute data, but in this part, we will look at how well he is doing in certain metrics and what that tells us about his playing style.
What we immediately see is that he scores really high in the attacking metrics, especially on goals (99th percentile), xG (99th percentile), assists (94th percentile), and progressive runs (91st percentile). This tells us that he is very attacking-minded for a midfielder.
When we look closer to what he can do when we look at the more attacking profiles compared to wingers, attacking midfielders and strikers – we can see some interesting stuff there too.
When we look at this comparison we can still see how high Simons scores in goals per 90 (93rd percentile), xG per 90 (91st percentile) and in shots per 90 (86th percentile). This indicates that his participation and style in attacking, is quite present in the attacking phase of the game.
Ball progression
The modern attacker isn’t only concerned with dribbling and crosses — but he/she also needs to be comfortable on the ball and progress play from it.
In the scatterplot above you can see the progressive metrics of progressive passes per 90 and progressive runs per 90. Simons does quite well here as he scores jjust above average in the progressive passes metric, and quite comfortably above average in the progressive runs metric. There are a few players better in progressing the ball, so he isn’t elite in this regard.
Dribbling
DRIBBLING
So how decent is he with the ball on his feet and going into the 1v1s? In other words, how many dribbles does he have per 90 minutes and what is his success rate?
If you look at the graph above you can see that he 4,75 dribbles per 90 in the Eredivisie so far, in which he scores above the average. When we look at the successful dribbles going with that number of dribbles, he has 50,78% – which is above average, but he doesn’t excel in it.
Xavi Simons is decent at dribbling, but how does he do that? You can see that in the video below.
KEY PASSING
Every player makes passes in a game, but which passes actively contribute to the progression and construction of an attack? You can see some of these metrics in the beeswarmplot below.
As you can see in the graph above, Simons scores in the average to high average in almost every metric. There is not one significant metric where he doesn’t score as well. However, he scores excellent in the assists per 90 metrics.
As you can see in the heat map of passes above, Simons does the majority of his passes on the edge of the attacking third and in the middle third. As we see here is that he passes the ball overwhelmingly in the central areas and zone 14, so he also can go to the right and left – as he floats throughout the final third.
What’s interesting is how he makes key passes. He scores in the high average, but the intent of his through passes does tell a lot about how he can help in an attack.
SHOOTING
Simons does often come in the position to shoot, but how does he do in the quality of shooting?
In the shot map above you can see where Simons has conducted his shots in the 2022/2023 Eredivisie season so far. He had 25 shots of which 7 went in goal. 88% of his shots were on target and he generated a total xG of 4,43 — the latter meaning that he is overperforming with +2,57.
Apart from shooting in the box, he loves to shoot from just outside the penalty area – on the edge of it. It indicates that he loves to come into zone 14 and execute shots from there.
ASSISTS
Not only did he score a lot in the Eredivisie, but he also provided 3 assists during the season. In the video below you can see his assists during the season in all competitions.
FINAL THOUGHTS
It was quite a surprise that Xavi Simons made the move to PSV from PSG and it wasn’t on loan. For many people, he was the academy player that hadn’t shown his quality yet for the senior sides. I think it’s fair to say that he has made an impact with PSV in the Eredivisie so far.
It’s very early in the season, but it looks like Xavi Simons can lead an attacking formation next to Gakpo and have a meaningful goal contribution in doing so. He will be one of the best players in the league soon and perhaps his path in Europe’s elite will be open again.
A disappointing result for Dutch football last night was when PSV lost their game against Rangers and failed to qualify for the Champions League. Not only will we see PSV in the Europa League, but it has also increased the likelihood that Cody Gakpo might make a move to the Premier League.
In this article, we will look closer to his 2021/2022 Eredivisie season with PSV.
Cody Gakpo has been instrumental for PSV in attacking in the 2021/2022 season and was one of the focal points in the attack. He can be considered as a great finisher, but also a top creator amongst his peer in the Eredivisie. An exciting talent who is ready for that next step.
We will use data and video to illustrate how Gakpo has done in the Eredivisie 2021/2022 and we will focus on the winger position as well as the striker position.
CONTENTS
Biography
Seasonal stats
Positions/roles
Ball progression
Dribbling
Expected threat
Key passing
Shooting
Assisting
Expected goal contribution
Comparison with Antony
Final thoughts
BIOGRAPHY
Name: Cody Gakpo
Date of birth: 07–05–1999
Nationality: Dutch
Position: Left winger/striker
Contract expires: 30–6–2026
Current club: PSV
Previous clubs: PSV (Y)
International: The Netherlands (7 games)
The question is when we look at Gakpo: what profile does he have? He is good at scoring goals and providing assists. He is good in the air and can link up pretty well. These things might suggest he could do a fantastic job as a striker.
But, if we look at the game he played in domestic competition — the 5–3 Supercup win in the Netherlands — he was more winger with playmaking abilities. He collected the ball in the middle third, dribbled, and made a run down the line. and then won the 1v1 against the right full back. After he had done that he would either cut inside or go the line — providing crosses to Guus Til — who scored twice on a good cross from Gakpo.
Then, we could also argue that in the same game he has shown striker’s instinct. After the Ajax goalkeeper couldn’t handle a shot from distance, Gakpo moved quickly to get the rebound and score a goal. If this says anything, it is that we should put him in one or the other box. We should celebrate his diversity and versatility on the pitch.
The big question is, how will he fit in at a team like Manchester United? And do they really need him? With Ten Hag, Manchester United have started to play a different brand of football and there’s something in particular asked from the wingers and the strikers.
He is not a pure winger, but a modern winger with playmaking skills and that can come in handy at Manchester United. He is a whole different player than Antony for example, but both have their qualities. While Antony is more direct in his play and wants to draw defenders to get that 1v1 going, Gakpo will try to involve more teammates and use a passing style of play to get to the optimal positions to great a goalscoring opportunity.
SEASONAL STATS
If we look at this specific pizza plot, we can say a few things. But before we turn into the meaning, it’s good to stress that this mostly gives us a stylistic idea of the player rather than a definitive performance one.
What we can see is that there are three metrics in which he scores under the 86th percentile: shots on target %, head goals per 90, and successful dribbles %. In all the other metrics he scored in the 86th percentile or higher. In the xA per 90 (96th percentile), assists per 90 (98th percentile), goals per 90 (92nd percentile), and progressive runs per 90 (91st percentile) — he really shows why he is spoken about so much.
In the image above you can see how Gakpo compares to his peers on the data metrics selected. The average is in blue and Gakpo in red. Gakpo is better in all but two metrics. In the metrics of head goals per 90 and shots on target % — he scores under average.
Positions/roles
In the image above you can see the positions in a 4–2–3–1 where Gakpo can play. He is the best suited for the wide midfield/wingers role, where he needs to make runs down the line and in doing so provides passes for the attackers in PSV side or cut inside and shoot himself. He can also play the striker role in this formation with movement to the wide areas.
In the image above you can see a 4–2–3–1, but he can play as a wide midfielder in a 4–4–2, 4–5–1 or 4–1–4–1 too. If you play with three attackers in a 4–3–3, he will play higher up the pitch as a left winger.
BALL PROGRESSION
The modern winger isn’t only concerned with dribbling and crosses — but he/she also needs to be comfortable on the ball and progress play from it.
In the scatterplot above you can see the progressive metrics of progressive passes per 90 and progressive runs per 90. Gakpo does really well here as he scores above average in the progressive passes metric, and above the progressive runs metric. There are only a few players better in progressing the ball.
DRIBBLING
Gakpo is excellent at dribbling, but how does he rank to others in this metric?
In the scatterplot above you can see how well the player are scoring in terms of volume of dribbling and the success rate of those dribbles. As you can Gakpo has the most dribbles per 90 of all the attackers, and while he hasn’t the highest percentage of completed dribbles — he is in the top tier for both these metrics.
EXPECTED THREAT (XT)
The basic idea behind xT is to divide the pitch into a grid, with each cell assigned a probability of an action initiated there to result in a goal in the next N actions. This approach allows us to value not only parts of the pitch from which scoring directly is more likely, but also those from which an assist is most likely to happen. Actions that move the ball, such as passes and dribbles (also referred to as ball carries), can then be valued based solely on their start and end points, by taking the difference in xT between the start and end cell. Basically, this term tells us which option a player is most likely to choose when in a certain cell, and how valuable those options are. The latter term is the one that allows xT to credit valuable passes that enable further actions such as key passes and shots. (Soccerment)
So how does Gakpo contribute to attacking threat in the Eredivisie?
If we look at all these actions we can see Gakpo is the second on the list of highest xT generated throughout the season via carries. He has an xT of 2,00. Only Tavsan (2,66) is better.
KEY PASSING
Every player makes passes in a game, but which passes actively contribute to the progression and construction of an attack? You can see some of these metrics in the beeswarm plot below.
As you can see in the graph above, Gakpo scores quite high above average in almost every metric, only not the passes to the final third. He scores excellent in the assists per 90, xA per 90, and passes to the penalty area per 90.
What’s interesting is how he makes key passes. He scores in the high average, but the intent of his through passes does tell a lot about how he can help in an attack.
SHOOTING
In the scatterplot above you can see the metrics of shots per 90 and expected goals per 90 combined. as you can Gakpo scores above average for both metrics, with only a few player scoring above him.
When we look at the expected goals and the actual goals we see that he averages 0,46 xG per 90 and 0,53 goals per 90 — this means that he is slightly overperforming on his xG.
Gakpo does sometimes come in the position to shoot, but how does he do in the quality of shooting?
In the shot map above you can see from where Gakpo has conducted his shots in the 2021/2022 Eredivisie season. He had 81 shots of which 12 went in goal. 35,8% of his shots were on target and he generated a total xG of 10,52 — the latter meaning that he is overperforming with +1,48.
Apart from shooting in the box, he loves to shoot from the left side inside the penalty box. More than half of his shots come from this area.
ASSISTS
In the scatterplot above you can see shot assists and expected assists combined. A shot assist is a pass that leads to a shot. This can lead to an actual assist but it doesn’t always have to. As you can Gakpo is in the top 3 in both these metrics, with Mahi and Tadic trumping him in one of the metrics.
Not only did he score a lot in the Eredivisie, but he also provided 12 assists during the season.
As you can see he has an expected assists number of 0,37 per 90 and while others do score better on that front, he has an actual assist number of 0,53 per 90 — which means he is overperforming quite significantly per 90 minutes.
EXPECTED GOAL CONTRIBUTIONS
If we look at the expected goal contributions per 90 minutes we can see something very interesting. Gakpo is expected to contribute to roughly 0,82 goals per 90 minutes. Which in this case makes him one of the more complete strikers, because he seems to be equally good in finishing as in creating — which makes him a rather unique player.
COMPARISON WITH ANTONY
Frequently spoken about is the comparison between Gakpo and Antony. While they are two very different players and Gakpo likes to engage more in passing and Antony more in 1v1s — it’s interesting to see what their output is. Gakpo scores better in the data on all but two metrics: progressive runs per 90 and shots per 90. In all the other data metrics — Gakpo scores higher.
FINAL THOUGHTS
Cody Gakpo has had a great season with his PSV, but there is always the question of whether he can show in the top domestic games or in Europe. And, rightfully so. Domestically, however, he has become a very prolific player in both goals and assists. He also poses a great threat to any defence with his pace, 1v1s, and dribbles.
In terms of providing and contributing directly to a goal, he does really well with his goals and assists. Will he be the answer to Manchester United’s woes on the flanks? Probably not, but he will provide squad depth that will absolutely contribute to their attacking play.
We often speak about the competitive nature of teams in different leagues in Europe. There is this strange idea that most leagues aren’t really competitive by nature, and I think that’s a rather arrogant view of looking at it. I think this has been said a lot about the Spanish league and I think there’s no real truth in it.
Barcelona obviously is a very good side, but what fascinated me in Spain were the three teams fighting for UWCL spots: Real Madrid, Atletico Madrid, and Real Sociedad. In this tactical analysis piece, I will look closely to the latter – as they finished second in the Primera Ibedrola with six points more than number three Real Madrid. They now will face Bayern München for a place in the UWCL group stages.
Context
Real Sociedad have been present in the Real Sociedad for quite some time now and the last season can be seen as a great development from recent seasons. In 18/19 they became 7th, in 19/20 they became 6th and in 20/21 they became 5th. Every year they tried and achieved a better ranking on the table than the year before. Their aim was to grow into the higher rankings of the league and they did that, but in this analysis, we will look into the tactics and see how second place was achieved.
Formation
The two most used formations by La Real were the 4-1-4-1 and the 4-3-3. In the last few games, the formations looked like this on paper:
For the majority of the games, Sociedad played with a 4-1-4-1, and their aim was to have sufficient defensive coverage in case of a counter-attack, but still have a high-tempo ball movement with their four-woman midfield. The back line consists of Nuria Rabano on left back, Vanegas and Etxezarreta as the central defensive duo, and Poljak on the right back position. This doesn’t change throughout the formations. Torre plays as the deepest midfielder or defensive midfielder. Her role in the 4-1-4-1 is more defensively and acts as the connection between defence and midfield, in the 4-3-3 she moves up the pitch and is more involved with the passes going forward.
Another constant in midfield is Gili on the left central midfield position, but the right position changes. Eizaguirre or Garcia play there – but with Eizaguirre, it’s never really certain where she will play. She can play on the right and the left in midfield – centrally and wide – but also in the attack as a winger or even as a striker. Her versatility is a huge asset to this squad. Franssi always plays as the lone striker and Sarriegi is a versatile wide midfielder/striker who can play on both wings, as well in midfield as in the attack.
4-3-3 formation Real Sociedad vs Madrid CF
As often argued, a formation is just a starting point to start a game or re-start after a certain development, but in the image above you can see that even in the 4-3-3 – Torre will play deeper. In fact, she plays on the same level as the full backs, which gives an interesting 3-2 dynamic for the defensive players.
Build-up and attacking play
Real Sociedad are calm on the ball, especially when building up from the back. The goalkeeper has the role of acting as the 5th passing defender and is actively engaged in the build-up. The key to building up is to pass the ball at a high tempo and pace, to create space elsewhere on the pitch.
Next to that they want to pass the ball quickly in the defensive third, but be more passive and patient with it in the middle third – they focus on carrying the ball there and dragging players out of their position in the process.
By combining these two things, they try to create space in the final third, which can be triggered by one through pass or key pass.
In the video above you can see how La Real do this against Rayo Vallecano. They use the passing, the movements to drag players out of their position and the decisive pass by Eizaguiire sets Franssi up for a goalscoring opportunity.
In the video above we see Real Sociedad in their game against Madrid CF, playing from right to left. What they do here is that the full backs go higher up the pitch, leaving the two central defenders alone with the goalkeeper. What creates more space is the fact that Torre drops down between the two central defenders. This meant that Madrid needed to follow through with their marking and opening up space in the defensive lines. Left back Nuria Rabano recognised that and recognised the run behind the defence, and provided the long ball that give way to another 1v1 with the goalkeeper.
When they get pressed high and don’t have the luxury of time on their hand, they need to revert to other measures. In the game against Sevilla, we see an aggressive press in the attacking third and middle third from Sevilla’s perspective. The preferred passing game can’t be played and therefore they revert to the long ball.
The long ball is played into the attacking midfielders who aren’t only technically gifted, but also have a physical presence that allows them to win (aerial) duels, control the ball and pass it forward to the striker(s). In winning the ball, passing it forward, and giving the through ball – from the long ball – they are set up in a 1v1, as you have seen in the video above.
Defensive style of play
In the defensive side of the game, Real Sociedad need to react and like to have two lines of defence. This can be a 4-5-1 without the ball or even a 5-3-2 without the ball, depending on how deep Torre will drop between the central defenders.
Torre drops deep between the central defenders, effectively making a back-three. The full backs complete the back-five or a 3-4-1-2, depending on how they position themselves.
So how do they conduct themselves defensively? They want to make sure they always overload the opposition and limit them in their movement. They give room on the flanks because they have the conception that dominating the central zones is more important.
In this game against Sevilla, we see that Sevilla doesn’t find many passing options through the middle, but resort to looking for the wide areas with long balls. When they do that, La Real struggle to sufficiently deal with the attacks and concede goalscoring opportunities.
In the video above you can see what happens when the opposition tries to attack through the middle with a through ball. Initially, it seems dangerous, but because the central areas are marked very well and overloaded, the opposition has to go to the wide areas. Real Sociedad do really well to block passing lanes and in the end the opposition only has the option to shoot, which didn’t trouble the goalkeeper too much.
When they have a solid defensive line at the back and the opposition is doing their build-up, Real Sociedad do have a good way of dealing with the attacks.
Transition defence to attack
Another phase of play we can look at is the transition phase from defence to attack. How do Real Sociedad convert from a deep defensive formation to an attacking formation within a few seconds? As we have seen La Real used the defensive midfielder a lot in the defensive phases of the game and the midfield consisted of the attacking + central midfielders + wide players. As soon as they regain possession of the ball the striker goes higher and is a player to receive and hold the ball.
After that, she makes runs towards the flanks or remains in her position to give her teammates the time to progress up the pitch as well. This can be seen in a few examples of counter-attacking football employed by Real Sociedad.
In the video above you see Real Sociedad against Rayo Vallecano when Vallecano have the ball. Real Sociedad have six players behind the ball, with the whole midfield dropping deep as well, with Eizaguirre as the most progressive player. As soon as they intercept the ball they go into attacking mode.
Because of the high regain and the physicality of Eizaguirre, the team can progress quite easily into the middle third. Vallecano have seven players in the defensive lines, but Real Sociedad do have six going into that middle third and they can pose a real threat. Especially when Eizaguirre holds on to the ball and allows the wingers to make runs down the line. After the pass comes and the cross comes in the box, we see the strikers and the left winger attacking that cross – posing threat to a defence because of their pace and movement, not because of their numerical superiority.
In this counter-attack against Sevilla they conceded a corner first. It’s an interesting situation because as defence you play very deep, but the attacking side will be mostly in the penalty area too. Initially, they get the ball but aren’t quick with going forward and allowing the rest defence of Sevilla to re-group.
What’s interesting here is that on one hand the defender plays back to the goalkeeper who will kick it long into an area where no player is situated yet. Eizaguirre makes the run into that area, dragging defenders with her while she tries to create something. At the same time, she opens space for Franssi who was playing deeper, to go into and pose a threat to the Sevilla central defenders.
In the video above you can see Real Sociedad in their game against Eibar. Real Sociedad regain possession of the ball on the right side of the pitch and that’s also where the heavy marking is employed by Eibar. The pressure they want to put on Real Sociedad is aggressive, but La Real manages to surpass that by having high tempo passes and runners. You can see that the two runners on the left have a lot space to make their runs into.
Franssi passes the ball to Eizaguirre and after that, she goes into the striker position high on the pitch. Eizaguirre comes into the central zones and zone 14, while she allows space for her teammate to go into the left wide area and provide support from there. In the end, Eizaguirre carries the ball into the box and she is defended well, but these counter-attacks do give Real Sociedad strength in attack.
Transition attack to defence
Due to the attacking set up employed by La Real, they have to risk being exposed in a counter-attack in transition. This was very visible in their game against Madrid CF last season. What usually happens is that one central defender stays very deep, while the other central defenders form a two with Torre and the full backs are positioned high on the pitch together with the wingers.
In case of a counter-attack by the opposition, they can get caught on the break when the opposition is quick, has a higher number of runners going with the ball and the full backs aren’t fully cooperating.
This also happens in the first counter-attack against Madrid CF. A long ball comes into the middle third and initially, it looks dangerous for Real Sociedad before the attack is slowed down. The striker however doesn’t give up and holds the ball long enough to get support. This is where they can get hurt, as they aren’t always as focused in defence in case of a counter-attack; the defenders switch off when attacks are happen in the other side of the pitch and in defence they will make errors when pushed.
In the end it’s a 5v3 situation in and around the box, but even then Madrid CF come very close to a goal – thanking Leta for a good save.
They are sloppy in midfield at times and when playing against a direct opponent like Madrid CF, you will face threat from counter-attacks. One direct pass can disrupt the rest defence, but in this case no one is switched off and recover very quickly.
There aren’t options for the opposition and Real Sociedad have a numerical superiority in the final third of 8v4, which in the end makes it much easier to regain possession of the ball and eliminate the danger faced.
This particular thing with now being fast enough in recovery mode, can also be seen in this attack by Madrid CF. Even though this isn’t the highest pace counter-attack or most direct, they still are allowed a lot of spance on the left side as the right full back and right winger don’t really have the intensity to trail back.
In failing to do so, they allow the opposition to attack that side and invite threat into their defensive third. In the end they recover well with a sliding tackle, but the lack of intensity and defensive vision can cost them sometimes.
Creating goalscoring opportunities and scoring them
We have seen how they build and construct their attacking play, but how they convert that into goalscoring opportunities? In others words, how do they create shot opportunities close to the opposition’s goal? Let’s have a look.
In the game against Tenerife they managed to score a goal through actions through the middle. In going forward it’s important for the midfielders to be open to receive the ball and as the ball is played to them, the third-man runs are employed. In doing so, they can pass the ball directly into the dangerous areas and have an advantage. The opposition then needs to recover and as you see in the clip above, La Real exploits this very well and the defenders don’t know who or where to mark, leading to a simple tap in, in the end.
In the video above you can see Real Sociedad in their game against Rayo Vallecano where they scored a very exciting goal. They like to be dominant on the ball and pass it around as much as possible to stretch the defensive side.
As soon as the pressing is triggered by Vallecano, La Real manages to be flexible and move around a lot, chosing unexpected passing options. When they do so, it’s one or two touches before they reach another player and in doing so they use their personal skill to beat an opponent. Usually they would go higher up the pitch, but with Eizaguirre on the ball – she just has a fantastic striking technique and scores a great goal.
Another Eizaguirre goal from longe-range? Yes, it is. But it’s more about the way Real Sociedad press in the middle third to get the ball. It isn’t successful at first, but they keep at it and make life difficult for Sevilla in this particular clip. They make sure to block passing lanes, forcing decisions and when the oppositions want to turn – they recover the ball and have all eyes forward. A great piece of skill to score the goal, but the press in the middle third is what made this goal for Real Sociedad.
Real Sociedad can play through the middle and create chances there as we have seen in the videos above, but in this clip where they play Real Betis – we see a different form of utilising space in attafcks. They primarily focus on exploiting the space on the wings.
In this particular example, Nuria Rabano gets the ball from deep and holds it. As soon as she spots Gili, she combines with her and immediately goes into area in and around the box. Because of her good cross and passing, she delivers it brilliant on a platter for Kinden Jensen, who can easily finish.
Player to watch: Eizaguirre
Nuria Rabano left for Barcelona and was a vital player in their attacking set up, but Nerea Eizaguirre is the player that makes this Real Sociedad team tick.
As you can see in this video, with basically all her actions in attack – she is great on the ball and is strong. She can dribble and carry the ball into dangerous areas, provide the key pass or a long pass to a vital area and is always present in the right areas to attack the space as well.
She is in my opinion a great versatile player who can play in central midfield, attacking midfield, on both wings and can even play as a false 9 when required. When she is on the ball, something happens. She has this kind of magic on the ball which draws defenders to her and opens up soace for runs for her teammates – which she often can spot. Her numbers in goals and assists are impressive, and as you can see from her goals, she shows her shooting qualities in doing so.
Final thoughts
Real Sociedad had a great season and I think they have shown what they can do on the ball a lot. They have challenged the likes of Real Madrid and Atletico Madrid, and finished above them – securing a UWCL spot in which they will now feature against Bayern München.
It will be a tough match for La Real against the Bavarians, but they will pose a lot of threat on the ball for the Germans as well. We could see an exciting match up that will be hard fought out between the two sides. It’s also an example that not only Barcelona have a good team, but the quality of the Spanish league as a whole is good. And growing.
In terms of the league this year, it might be very hard for Real Sociedad to copy last year’s results. Real Madrid have very much strengthened their squad and Atletico Madrid will look for that UWCL spot as well. Losing Nuria to Barcelona is a big hole to fill, but the key principles, philosophy and tactics are still there. It wouldn’t surprise me if Real Sociedad will still be in and around those UWCL spots.