Manchester United have employed Erik ten Hag as manager of the first team. There has been said and written enough about Ten Hag, but he is not coming alone. Alongside him, Steve McClaren and Mitchell van der Gaag have joined the Manchester club. Especially the latter hasn’t been explored too much by the broader public, and that’s why I’m writing this analysis.
In this analysis, I will look at the Portuguese influences on his managerial/coaching approaches, his defensive qualities, and his impressive coaching period at Excelsior Rotterdam during 2016–2018.
Portuguese influence
Mitchell van der Gaag did his UEFA C and B in the Netherlands but managed to do his UEFA A and UEFA Pro in Portugal. And, that’s where the difference is quite noticeable. While in the Netherlands, learning to coach is focused on problem-solving, in Portugal Van der Gaag learned to adopt, adapt and improve.
In Portugal, it’s more based on learning from experts. Experienced coaching comes from learning from experienced coaches while learning from being together with other coaches. In that way, you take lessons from those coaches and you take what you think is important from them.
Defensive qualities
To be able to properly defend, that’s a true art form. Defending is an art, but in different defensive situations, different solutions are applied. Taking from the Portuguese approach, the field can divided in three different thirds:
The idea of defending learned by Van der Gaag in Portugal is that you clear everything that comes in the red zone. No build-up, but only clear the ball and make sure the ball is out of that zone.
That’s not something required in the modern game but has lead Van der Gaag to a fundamental truth. Football isn’t one way or the other, it’s a pragmatic game and in some situations, you need to clear balls. In others, you need to play out from the back.
According to Van der Gaag, a defensive organisation is the foundation of every successful team. We will see how he did that with Excelsior.
Tactics at Excelsior Rotterdam 2017–2018
Excelsior is relatively small club and whenever they are in the Eredivisie, it’s all about survival. Now defending is so much more than just clearing balls as what I have shown you above, but in terms of playing a defensive style of play in the Eredivisie — clearing balls is a big part of it. It all depends on the quality of your players. When the opposition does press high and aggressively, playing out for the back is only for the players with a certain amount of technique and pace in their actions. These are usually not found in the bottom half teams in the Eredivisie. That’s the pragmatic approach from Van der Gaag.
Having been very successful in attack with Belenenses and getting promotion to the Primeira Liga in Portugal, the approach with Excelsior should all be about defensive organisation.
He was very successful in his way of approaching games at Excelsior, leading them to a 12th and 11th place in the Eredivisie table, but in this piece, we will mainly focus on his tactics in the 2017–2018 season.
Formation
Van der Gaag sees the formation of a team as a starting point for the team, because it can’t change quite often. In the 2017–2018 season he used the 4–2–3–1 formation 76% of the time.
4–2–3–1 in possession
The 4–2–3–1 consisted of a back four of Fortes-De Wijs-Mattheij-Karami with a double pivot of Kool-Faik. The double-pivot was quite interesting as both players can be considered as playmakers and more of natural 8s or 10s, rather than 6s. The attacking midfield consisted of wide midfielders Bruins and Elbers, who both had different roles. Messaoud was the attacking midfielder and Van Duinen was the sole striker.
The 4–2–3–1 in possession often changed into a sort of 4–2–2–2, with Bruin inverting to the midfield and Messaoud going wider to the right. Van Duinen would leave his striker position and move to the left flank, while Elbers would assume the striker role.
The formation would change when the ball was lost and the transition would occur.
When the ball was lost, Excelsior usually defended in a 4–4–2 formation. This meant that #10 Messaoud joined Van Duinen in a two-strikers system. Bruins and Elbers dropped deep to join the double pivot and form a 4-man midfield. The defence and the midfield would play close to each other in order to leave little space in between the lines.
At some moments, the formation in defence would even become a 4–5–1. This meant that Koolwijk dropped down to the defence and became the third central defender. In doing so, he left space in the double pivot, which was then filled in by Messaoud, who dropped. Van Duinen was the sole striker in this formation.
Attack
The thing with a defensive organisation is that you try to play from your defence. In other words, the defensive organisation should be solid and when you attack it should be direct, in order to not disturb your defensive organisation. Excelsior did this with playing Van Duinen up top and letting him be the holding player. The ball needed to be controlled just long enough for other people to progress on the pitch.
This can also be seen in the game against Willem II. Van Duinen drops very deeps, but drags defenders with him and allows the attacking midfielders to progress on the pitch. Bruins will go into wide area on the right, while Messaoud in the middle will go to the penalty area, anticipating a cross.
The long ball is important to be direct, but even when pressing the shape of the three players is maintained. Van Duinen presses the player on the ball and gets possession of the ball. After that, Messaoud immediately moves forward into the penalty area, while Faik remains available for passing. In doing so they can move forward with pace, but still have options going forward.
In the image above you can Excelsior in their game against VVV-Venlo in the Eredivisie. The direct passing style does suit the direct approach by Van der Gaag. In just two passes he sets the full back up for a cross. The central defender passes to the inverting and dropping wide midfielder. In doing so, Garcia opens space for a run down the line for right back Karami. In just a few touches and movements, Excelsiors opens up play in the middle to the final third. Faik and Koolwijk assume their positions and stay there, in order to make sure the rest-defence is maintained.
In a slightly more advanced situation against VVV-Venlo we see how the unit of three midfielders stays conservative in the middle third, while Van Duinen has dropped and claimed the ball. Right back Karami has advanced and is a good option for Van Duinen to pass the ball to.
What’s interesting here is that two attacks up top, are the two wide midfielders/wingers who have inverted to attack an eventual cross from the right flank. The idea is that from this moment on, two or three touches are needed to come to a goalscoring opportunity.
Defence
We have seen how Mitchell van der Gaag constructs his attacks or wants to come to goalscoring opportunities, but how does his team portray themselves in the defensive phases of the game? How does he make sure the opportunities are kept to a minimum?
Here you can see how Excelsior try to defend with four people as a unit and move toward the player with the ball. Ball-oriented marking. In this instance against Ajax, they try to do that in order to isolate Huntelaar, who likes to play between the lines.
In the image above you can see how deep the two defensive lines defend to make sure Ajax has as little chance to be successful. The defence is usually 4–4–2 or 4–5–1, but in this instance, it’s a 4–4–1–1 formation, as Messaoud is marking Ziyech here.
In the game above you can see how the two defensive lines are deep and making sure the Heerenveen players are covered well. This means that there is an 8v4 overload from Excelsior. With Messaoud pressing the player on the ball, the progression of this attack is made more difficult.
In this game, we see how NAC on the break as Excelsior need to transition to their defensive shapes. As you can see the back four remains intact, and the midfield consists of three players initially, but they are positioned in a way that the defensive capabilities of Excelsior are favoured.
What will he bring to Manchester United?
Van der Gaag is a very strong defensive-minded coach. He will focus and improve the defensive lines and will make sure it’s not only based on theories but will make it pragmatic. He believes in a personal approach and will talk with the players concerned, getting to know them and giving them the motivation to give it everything.
He is a talented coach who knows the differences between winning trophies, developing young squads and fighting against relegation. This experience in defending will prove to be of a vital part of Erik ten Hag’s management of Manchester United.
The season has ended and it’s safe to say that Chelsea is a club where it’s never quiet. One of my favourite strikers in the game is said to be disrespectful and to have a bad season. But how did Romelu Lukaku really do at Chelsea in the Premier League 2021/2022? Time to find out.
I will use data to analyse his performances in this piece. I will use event data provided by Understat/Opta and match data provided by Wyscout. The comparisons will be made with players with at least 900 minutes/10 90s in the Premier League.
Season stats
In the image above you can see a percentile radar. This shows us how well Lukaku has performed in certain data metrics in the 2021/2022 Premier League season compared to his peers.
If we look at this particular data we can speak of an average to relatively poor season — bearing in mind that Lukaku has played the 37th most minutes of the strikers we look at. In the shooting metrics, he does score above average in each category bar the shots on target in % metric.
In the following aspects of this analysis, we will look closer at the shooting and assists metrics
Shooting
In the scatterplot above you can see the metrics of shots per 90 and Expected goals per 90 (xG per 90) combined in one graph. If we want to look at the volume of shots Lukaku has and the corresponding quality of the shots or likelihood of that shot being converted into a goal, this graph helps with that.
If we look at Lukaku’s data we see that he has 2,16 shots per 90 during the Premier League season and a corresponding xG per 90 of 0,42. If you compare that to his peers, he scores slightly above average, as he is the top-right quarter of the graph.
So where did Lukaku shoot from this season?
In the shot map above you can see Lukaku’s shots in the 2021/2022 Premier League. It show all shots, with the red dots corresponding with the goals. He had 43 shots of which 8 went in goal with a corresponding xG of 7,02. This means that he is slightly overperforming.
When we look closer into his xG, we can see that he has 3,44 xG with his left foot (+0,44), 1,42 xG with his head (-0,58), and 2,16 xG with his right foot (-0,84). 6,07 xG comes from open play.
Assists
In the scatterplot above you can see the metrics of expected assists and assists per 90 combined. It shows us how well Lukaku is doing in the expected metrics in comparison with the actual assists given.
As you can see Lukaku has quite a low xA per 90 of 0,10, but what’s even more telling is that he hasn’t given a single assist during the season. He was expected to assist 3,36 times this season and not given one — meaning he underperformed significantly.
Comparison with peers
Final thoughts Is Lukaku a bad striker?No. Did he become worse over one season? No. There are many reasons why he hasn’t been doing as well as we would expect. While tactics are a big part of it, if we look at the likelihood of contributing to goals, we can make a few claims. He has scored more than you might expect, but also has assisted less than you might aspect.
Feyenoord. One of the big clubs in the Netherlands with the potential to be the biggest club, but that’s where it is usually left: potential. This goes for results, but it is also used for the players that are full of talent. They are doing well, especially in the Eredivisie, but too few have made the step from being a talent into a great player in one of Europe’s top leagues. But, it seems that there is one player that could change that all: Orkun Kökçü.
Biography
Name: Orkun Kökçü
Date of birth: 19–12–2000
Nationality: Turkish
Position: Central midfielder, attacking midfielder
Contract expires: 30–6–2025
Current club: Feyenoord Rotterdam
Previous clubs: FC Groningen (Y), Feyenoord (Y)
Current international: Turkey
Theoretical Frame With the theoretical frame, I try to look at what the scout report is meant to be saying about the player. In this case, I’m looking at the abilities of Kökçü in comparison to the league he most likely will go to. There have been rumors and interest from clubs in the English Premier League, so every claim and opinion in this piece will be in relation to his ability to play in that league.
The reason for this is that while Kökçü might be a top 5% player in the Netherlands or similar leagues, this might be completely different from other leagues. Not every good player in the Eredivisie will be a good player (instantly) in the Premier League and it’s important to keep that in mind when doing these reports.
Data and video collection The data used in this scout report comes from different sources. The match data which will be used in graphs and plots come from Wyscout and contains Eredivisie results only from the 2021/2022 season. The reason why this is is to compare the players in this league to Kökçü and not every player will have played the same amount of international games for club or country — hence only the Eredivisie. He is compared to midfielders in the league.
The event data used in pass maps, shot maps, and heat maps come from Opta.
The video clips come from Wyscout and have been clipped from full games or downloaded as clips from the platform. Again, all these are from Eredivisie games in the 2021/2022 season.
All the data and video have been accurate and up to date, collected on April 26th, 2022.
Position and roles Orkun Kökçü is a midfielder, but in that capacity has played in diferent positions this season. While he can be classified as a central midfielder, he has played the majority of his minutes in the Eredivisie this season, as a defensive midfielder.
Now, he is not a typical defensive midfielder, but here we have the debate between positions and roles. As position, he played as a defensive midfielder in a double pivot as employed by Arne Slot. Feyenoord usually plays in a 4–2–3–1 formation with Kökçü in that double pivot role.
If we look into his role rather than his position, we see the importance of him dictating play with his passes and progressing the ball from deep — allowing the attacking midfield trio to move up on the pitch. Therefore we can characterise him more as an 8 than a 6 on the pitch at Feyenoord.
Off the ball movement and positioning
In the image above you can see where Kökçü does his events during the games in the Eredivisie this season. While he plays in the double pivot, he is often seen in the left half space on the opposition’s half. Trying to penetrate the final third with his key passing, which we will see in the next section of this analysis.
In this role of his, he is responsible for progressing the ball further into the middle third and allowing others to become more advanced in either the wide areas or central areas. He is a player who opens up opportunities for the attacking players.
Key passing
In the image above you can see how well Kökçü is doing in the key passes per 90 and through passes per 90 metrics. He is doing well in both these metrics, as he scores above average with 0,58 key passes per 90 and 1,52 through passes per 90.
Key passing is of vital importance for a player like Kökçü as he is seen as the one that dictates play with his passing. He drops down from the midfield and poses as an instrument to connect the defence to the attack. His progression via key passing is instrumental as we will see in the next section, but his contribution to the attacking play is something he is considered for too.
In the graph below you can see how well he performs in the key passing metrics, compared to his peers on that position.
To illustrate his ability, I’ve taken three specific clips to showcase how he contributes to the attacking contribution via through passes.
In the video above you see a clip from Feyenoord vs FC Utrecht with Kökçü on the left. He receives the ball and spots a runner in the middle, making a movent to the left. His vision is the most important in this case, as he sees a run that most didn’t anticipate.
In the video above you see Feyenoord in their away match against Heracles Almelo, as Kökçü situates himself on the right side. He is in the box and makes himself available for the combination with the winger and as he gets it, he immediately passes it into the space which is vacant. By doing that the winger can invert and get ready for the cross.
In the video above you can see Feyenoord in their game against Willem II. Kökçü has proven to see where the space is for his teammates and in this example, that’s no different. The ability to find himself pressed but still pick out a through pass to an unmarked teammate, is something that makes him stand out.
Progression
We have seen above how well he does with progressing on the pitch via his passing, but how well does he with the ball on his feet? You can see that in the scatterplot below.
In the scatterplot above you see the metrics or progressive runs per 90 and dribbles per 90 combined. These metrics illustrate how well a player is doing on the progression of the ball on his feet, in contrast to the progression via passing.
Kökçü does above average in this metric as you can see, but isn’t exceptional. He has 2,27 progressive runs per 90 and 3,39 dribbles per 90. In the two clips below, I will show you how his dribbling looks like on the pitch.
In the video above you see Feyenoord in their game against FC Utrecht where Kökçü gets the ball on the left. It’s a combination that occurs often. He cuts inside and then moves outwards. At the moment he does that, a defender will step out and create space on the far end of the pitch – after which Kökçü will spot the runner.
In the video above you can see Feyenoord in their match against Willem II. Kökçü gets the ball in zone 14 and dribbles past his direct opponent, setting himself up for a shot. His attempt isn’t successful but it shows what he can do to get himself in a good position.
Expected threat
In the image above I have illustrated how well Kökçü does in the expected threat (xT) metric in this season’s Eredivisie. Before I look further into this, this is what xT is:
The basic idea behind xT is to divide the pitch into a grid, with each cell assigned a probability of an action initiated there to result in a goal in the next N actions. This approach allows us to value not only parts of the pitch from which scoring directly is more likely, but also those from which an assist is most likely to happen. Actions that move the ball, such as passes and dribbles (also referred to as ball carries), can then be valued based solely on their start and end points, by taking the difference in xT between the start and end cell. In the case of Grealish, his ball carry brought a 0.013 xT increase, and the pass added a further 0.26 xT. In short, he moved the ball from a low-xT cell (0.02 xT) to a much more dangerous area of the pitch (0.32 xT). Note that the xT action value can be negative for passes and carries that move the ball away from goal. – Soccerments
In short, how much does Kökçü contribute to the expected threat of a sequence of actions towards goal? If we look at the top 10 players of this season we see that Kökçü scores 3rd.
Shooting
In this part of the analysis, we will look at the quality of the shooting by Kökçü. In the scatterplot below you can see his expected goals per 90.
In the volume of shots, we can see that Kökçü does above average. He has 2,44 shots per 90. In the expected goals generated from those shots, the Feyenoord midfielder performs above average as well with 0,18 xG per 90. But it has to be said that he isn’t the most prolific striker of the ball in terms of generating xG.
Obviously, this tells us how he converts his shots into xG, but where does he take his shots? This will give us a more clear idea of why his xG is generated the way it is.
In the shot map above you can see where Kökçü takes his shots. He has 72 shots in the season so far, generating a total xG of 5,35. The actual goals he has scored have been 7, including 2 penalties. This means that he is overperforming his xG slightly by +1,65. This means that the likelihood of scoring is lower than his actual goal tally in the 2021/2022 Eredivisie season.
In the video below you can see all his goals in the Eredivisie so far:
Assists
In the scatterplot above you see the metrics expected assists and assists per 90 combined. This shows us how many assists Kökçü is expected to give per 90 minutes and the actual assists he gives per 90. In this aspect of his end product, he does very well. He has 0,26 xA per 90 minutes and gives 0,2 assists per 90. This means he is slightly underperforming with -0.06 per 90.
In total, he is expected to give 7,65 assists in this Eredivisie season and because he assisted 6, he is underperforming with -1,65. A notion of his assisting numbers is that he is the one for the set pieces, and therefore generates a higher xA than from open play.
Here are all his assists from the season so far:
Final thoughts
Orkun Kökçü is a talented player who is ready for the next step. He can definitely play in either the Bundesliga, La Liga, Serie A, Premier League or Ligue 1 – but he is suitable for some roles better than others. While he is used as an 8 in the double pivot, his data suggests that he is very good in the creating from the half space and zone 14, with his assists numbers being very good as well as his contribution to the expected threat.
As a central midfielder with an attacking mind, he could definitely contribute a lot as he likes to dictate play in the beginning of the attack, but also his danger in the attacking third. His attacking vision and awareness of runners is good, but his defensive contribution can be described as slow. For a box-to-box midfielder, he has a great work ethic and vision – also on the defensive side. But his pace between transitions is something he could work on, as well as choosing the moments where he takes a shot.
With Erik ten Hag set to be appointed the next Manchester United manager, I thought it would be a good idea to look at Ten Hag’s experience in the Eredivisie. Now, everyone has looked at his Ajax tenure – rightly so. But, I wanted to focus on his period at FC Utrecht which shaped him into an elite manager.
In this article, I will look at three different aspects of what he achieved and changed while at FC Utrecht:
Professionalism
Transfers
Tactics
Final thoughts
Before I get into that I wanted to say that the data in this article are from Wyscout. Furthermore, it’s important to stress that FC Utrecht isn’t a small club in the Netherlands. They have won the Dutch Cup three times as well as the Supercup once. Their ambition is to consistently qualify for the European play-offs in the Eredivisie as well as pose a threat to the big 4 (Ajax, AZ, Feyenoord, PSV).
Ten Hag has moved into the top, step by step. His managerial career started at Go Ahead Eagles where he achieved promotion to the Eredivisie. After that, he went to Bavaria and coached Bayern München II, before he returned to the Netherlands and coached FC Utrecht. His experience in Germany and his ambition made sure FC Utrecht started to develop on and off the pitch.
PROFESSIONALISM
It’s a bit extreme to call FC Utrecht a sleeping giant, but there is a massive potential to get good results in the league. This doesn’t only depend on what happens on the pitch, but you need to create the right context and environment for professional athletes to thrive. So how did Ten Hag do that at FC Utrecht?
First of all, he changed the training quantity. The first team was required to train more than once per day and the intensity would be higher in the training sessions. With that notion, the club also would track what the players were eating as Ten Hag firmly believes that every aspect of professional life should be of high quality. This also translates into the analysis department of the club. It was instrumental for his way of preparing that he could see event data translated into analysis, so he could track the players’ movements, decision making and on-ball activity.
In addition to this, there also was the matter of the training grounds – especially the pitches. They were taken care of by the municipality, but this changed as Ten Hag wanted professional groundsmen and the control that the club took care of the grounds. All this feeds into the change of mentality Ten Hag wanted to achieve at FC Utrecht. With Ten Hag you need to have the mentality to win every game and even if you win games, you always have to be critical of your own performance.
TRANSFERS
Transfers 15/16
In the summer of 2015, Ten Hag became head coach of FC Utrecht and in his first season, we saw two distinct things. First, he cut a lot of dead weight. Players who were earning too much or just simply weren’t good enough. As you can see on the outgoing transfers, 15 players exited the club during the whole season, with 12 players leaving in the summer.
He did attract a few players who became instrumental like Strieder, Letschert and Haller. Now Haller was already on loan with Utrecht, so he can’t really take the credit for that. In regards to what English media have said about not giving youth a chance, that’s utter codswallop. Ramselaar, Amrabat and Joosten all were included in the squad.
Finished 11th in the 2014/2015 season, Ten Hag did really well in his first season – finishing 5th and qualifying for the domestic play-offs for European football.
Transfers 16/17
In his second season, we see another shift in losing dead weight, majority of the players simply is’t good enough or their contracts have run out. However, a difference from a season earlier is that Ten Hag also has sold some of their most important players – as they have done exceptionally well. In selling Ramselaar, Letschert and Boymans – they have generated over €9 million for those three players.
If we compare that to incoming players they have only spent €500,000 on new players (Van der Meer, Jensen), the rest came on a free, from the academy or was loaned from another club.
Another relatively successful transfer period and it resulted in a good position in the league as well. As they finished 5th in the 2015/2016 season, they now finished even higher on the 4th place in the table.
TACTICS
Before we move into the actual analysis of the tactics and style of play, I will place the analysis into context. I’m going to have a look at the 2016/2017 season for a number of reasons. It’s the highest finish in the league under Ten Hag, his style of play was seen throughout the squad and it was the season that attracted Ajax to his coaching style.
There are different components to analyse:
Formation
Defensive play
Attacking play
Counter-attacks
Data
The progress in the importance of full backs FC Utrecht -> Ajax
Formation
Ten Hag’s most used formations in this particular season were the 4-3-1-2/4-4-2 (51%), 4-3-3 (18%) and the 3-4-1-2 (10%). This depends on the opposition of course, but what’s good to understand is that he didn’t want the traditional Dutch school of attacking football. He wanted to maximise results and is very pragmatic in his approach in doing so, therefore being different to most coaches in 2015-2017 in the Netherlands.
This 4-3-1-2 can also be classified as a 4-4-2, depending on the position of Barazite. Often he played more like a #10 and closer to the strikers and it became a 4-3-1-2 with three central midfielders – with Brama a bit deeper. But when you play with a midfield square you Brama as the defensive midfielder and Barazite as the attacking midfielder, with Ayoub-Amrabat providing support in linking the defence to attack.
That 4-4-2 could also easily become a 4-3-3 with Barazite playing as a striker with Haller and Kerk on the flanks. The role of the two strikers is important for their dynamic play. While Haller is strong in the air and has good link-up play, Kerk is agile, versatile, and strong. These two players complement each other in attack and have enough ability to set up the midfielders as well.
Defensive play
So what does the defensive structure look like under Ten Hag’s FC Utrecht? I think it’s worth noting that he doesn’t do this in the traditional Dutch sense. He likes to keep it compact and we can see a few interesting things in how he sets it up. He only has the full backs in the wide areas and most of the player (6) are situated in the half spaces.
Full backs in wide areas, rest compact in central zones
In the image above you can see the defensive set up. One of the interesting parts is that the #10 will go into the striker position when FC Utrecht is in the pressing shape. In doing so it enables the #1o to help the two strikers who assume the winger positions without the ball and do the pressing as such. This means that the first pressing moment is done by a winger (Haller/Kerk) and Barazite will press the goalkeeper when he receives the ball. Ten Hag wants to press with three attackers. This means that one will press the central defender on the ball, the striker will press the goalkeeper and the third defender will remain close to the other central defender, to block the passing lane:
Pressing with strikers
In the image above you see how this has been done with the three attackers pressing. First, the winger presses the RCB who can only pass without risk to the keeper in his eyes because the passing lane is blocked to the RB. The defensive midfielder is an option, but he will be pressed too. As soon as the keeper has the ball, the striker will press the goalkeeper who can only play it long.
The two strikers do not only position themselves to be ready for the transition but they are actively involved in the defensive process. This means that attackers are expected to have defensive qualities as well under Ten Hag. They need to block passing lanes, track back and make sure to stand in between the central defenders and full backs. Ten Hag sees it as follows: you attack with the collective and you defend with the collective.
In general, Ten Hag didn’t press aggressively with Utrecht, but as soon as the opposition got into the position in the middle third, they would be marked closely and attempted to win the ball there as it gives advantages in transition (see counter-attack). Again, there is a vital role to play for the #10 in following a central defender who steps out. If a central defender moves up the pitch and attempts to progress via a carry or pass, the #10 Barazite will follow in order to limit the threat, while the two attackers will assume their original role.
Attacking play
For Ten Hag’s FC Utrecht there was one thing most important: attacking through dominance in the central zones. Bar the two full backs, everyone is in these central zones. The reason for that is that the LB and RB create more space for the central midfielders in the central zones, which is vital for the build-up.
Attacking options via central midfielders
So how does Ten Hag construct attacks using the left and right central midfielders? In this case the left central midfielder was Ayoub and the right central midfielder was Amrabat. There are two scenario’s in how they conduct the build-up and be as direct as possible.
The first one is where a central defender reaches Ayoub. In this case, left central defender Janssen, passes the ball to Ayoub who has assumed the position away from the half-space and come into the wide area. He stretches play, creating more space in the central zones in doing so. Then, he has two options. He can opt to play in the feet of Haller on the left side or he can play it in space where Kerk has to make a run. Haller needs to connect with other players to create a chance, while the option for Kerk will mean a shooting opportunity.
The second one is where a central defender opts for the right central midfielder option. This is less direct as the one mentioned above. The central defender plays to the defensive midfielder (Brama) who has dropped deeper. He will pass to Amrabat (RCM) and then he will connect with the attackers. Instead of playing it direct and straight, he will opt to play a ball behind the defence, utilising Kerk’s pace. At the same time, Haller moves to the far post in order to await a cross. The role of #10 is to cover the ground behind Kerk in terms of making sure transitions will be less dangerous.
In the image above you can see how the #10 Barazite acts with his through passes in case of ball possession in the final third. There are two different options. Important here is that Haller is not involved in the receiving of the through ball, as he isn’t equiped to make that run needed.
The first option is to pass in a straight line towards the penalty spot. Kerk will lose his marker and make a run inwards to get in the ideal position to shoot. The second option is to pass the ball to the right, where the RCM Ambarat will make a run between the defenders and enter the box from the right side. This could prove a good shooting opportunity, but also a good passing option as both Kerk and Haller will make a run to the far post.
Above you can see how the attackers react to cross from Amrabat from the right half space. Barazite willl move into the box on the right, while both Kerk and Haller will move to the far post zone, to attack the cross. Amrabat and Troupee stay on the right, to create space in the central zones – and there is where it has to happen for Ten Hag.
Counter-attack
In Ten Hag’s vision for FC Utrecht, he most likely wanted to regain possession in the middle third. In doing so, the positioning of the attacking midfielder(s) is absolutely vital going forward. In this case, it’s Barazite. He is instrumental in the counter-attack set out by Ten Hag.
In the image above you see the situation when there’s a counter-attack after regaining possession by the LB. Earlier we spoke about the 4-3-3 in defence, but as soon as the ball is further on the pitch – Barazite will drop deeper. After the ball is regained in the wide area by the LB, Barazite will move up the pitch and assume a position between the lines. In doing so he can adjust correctly and pass the ball to either striker. Because the strikers are playing in the half-space they can move to the wing or invert, which gives the defenders problems and FC Utrecht options on the break.
When the ball is regained in the middle third by the midfielders, everything is set to be played directly. This often occurs with Amrabat and he has two options, play it straight to Barazite or play it long behind the defence for Kerk. Again, Haller will make a run towards the far post to anticipate a cross.
Statistics
So how well did Ten Hag’s FC Utrecht score on the different statistics during the 2016/2017 season where they finished 4th? You can see that in the images below. (There is an issue with the quality of images showing on the website, click on image and open in another tab for higher quality)
In the graphs above you see how FC Utrecht scored in the shots per 90 metrics compared to the other teams in the Eredivisie 2016/2017. FC Utrecht scores 9th on the number of shots per 90. Below that you see the graph of expected goals per 90. FC Utrecht scores 4th in this metric, which does suggest they take most of their chances
But how do they do when shooting, what is the quality of those shots? In other words, what the expected goals number per shot taken?
You can see that FC Utrecht has the highest xG per shot in the Eredivisie. They are 9th on the shots per 90, but when they come in shooting positions – they do this in the most optimal positions/situations in relation to the other teams in the 2016/2017 Eredivisie. Ten Hag wants to use his attacking play to maximise the chance of scoring a goal. His idea was to limit the shots from outside the box and move into more certain positions of scoring – this resulted in the high xG per shot, as shown above.
On the goalscoring front, they were 5th with 1,54 goals per 90 – with only Feyenoord, Ajax, PSV and AZ scoring more per 90 minutes. It indicated they are doing very well in attack, making sure they are in the right positions and capitalising on those goalscoring opportunities.
How did Ten Hag’s FC Utrecht do in defence? We use the metrics of conceding shots, expected goals and goals to review this.
In the graph above you can see that has the 4th fewest shots against per 90 minutes. Only Ajax, Feyenoord and PSV concede fewer shots per 90. The strongest defences in the leagues conceded the fewest chances, but how many goals are they expected to concede? This measures the quality of the chances given away.
The quality of the chances conceded corresponds with the shots against per 90 minutes. FC Utrecht has the 4th fewest expected goals against per 90 minutes. This strongly indicates that their defence has been pretty solid. This also can be seen in the goals conceded per 90: 1,07. This was the 4th best in the data of the 2016/2017 season.
It’s interesting to see the data because they had a very good second season under Ten Hag. They were better than AZ and only the traditional top 3 (Ajax, Feyenoord, PSV) were better than this FC Utrecht side. A very impressive achievement.
Players’ reception of Ten Hag’s philosophy
When Ten Hag came into the FC Utrecht management, players were rather sceptical of his ideas. He changed a lot within the club, but most of all it was his way of coaching during training sessions. The obvious question was: what does this way of working do for us?
With the way of coaching, it can be seen as follows. Ten Hag uses a lot of moments during situations with a training session or drill to coach players. He often stops play and coaches what he wants to see and that will lead to friction sometimes. He has spoken about it in Dutch media and no player really likes it. But if the methods start to pay dividends in the games, players accept them because in the end, they want to win.
The reason why Ten Hag does this is that he wants the team to control multiple systems and that requires a lot of detail and attention from the coaching staff. But he has also admitted that too much of this way of coaching and the freedom of creativity can be lost – while that is very important for certain types of players.
The way he tries to avoid those problems is not to say what has to happen in the situations he stops play, but to ask questions. He does this to activate the brain of the players and that they are aware of the thought process behind it. Being transparent in why he demands these things of his players, is where players will accept it more.
For Ten Hag, it’s about giving context to every possible situation that can happen on the pitch and teaching the players about risk management. Because in the game, the players have to judge the risk of their actions themselves.
Players don’t need to enjoy everything they do on the training pitch, but they need to understand why they are doing it. That creates understanding and acceptance. For that to happen communication is vital and that’s what Ten Hag has done very well.
The evolution of Ten Hag’s full backs
Being FC Utrecht, there are always a few games per season that you will be the lesser team. The games against Ajax, AZ, PSV, and Feyenoord are very difficult matches and one can expect to drop points. Ten Hag has shown his pragmatism here and has employed a 5-3-2 on occasion to make sure defensive display is the priority.
When he made the step to Ajax this changed. You are expected to win everything and as a consequence, the view of the game will change as well. Ten Hag had to adapt to the stature and philosophy of Ajax and I think this is an interesting point as many critical pundits have shared their feelings about it. We have seen above that at FC Utrecht, Ten Hag wanted to create from the central zones and the positioning and actions of the full backs were in aid of that. They stood wide to create more space in the central zones, but this had to change at Ajax.
He was expected to play an attacking style of football that saw wingers in the wide areas as they play with three attackers. Keep the field wide to stretch the opponent and use the wingers to provide danger into the box. This also meant a change in the role of the full backs.
He had to adapt and there’s been a lot written already about it. I suggest you have a look at this thread by Jamie Scott. He analyses in great detail what Manchester United can expect from Erik ten Hag based on his Ajax tenure. Especially the (over) reliance on full backs is worth the read, as it’s something that’s different from his FC Utrecht period.
📌 Erik ten Hag to Manchester United [thread]: – ten Hag’s Principles of Play at Ajax – Strengths and Complexities of the System – Suitability for the Premier League and United’s Squad pic.twitter.com/tfJO3paxDN— Jamie Scott (@JamiescottUV) March 22, 2022
FINAL THOUGHTS
Erik ten Hag came into international media due to his excellent European exploits with Ajax. But this wasn’t the beginning of his success. The promotion to the Eredivisie with Go Ahead Eagles, his successful spell with Bayern München II and of course his time at FC Utrecht, made him what he is today.
At FC Utrecht he has shown how to elevate a club from mid-table to sub top, whilst competing for European tickets as well. He has taken a squad, cut the dead weight and taken to the transfer market combined with academy players. His distinct style of play, his professional mentality throughout the whole club and consistency in performances – have formed him and prepared him for the Ajax job. The progression from FC Utrecht to Ajax is important to understand what he can do for Manchester United.
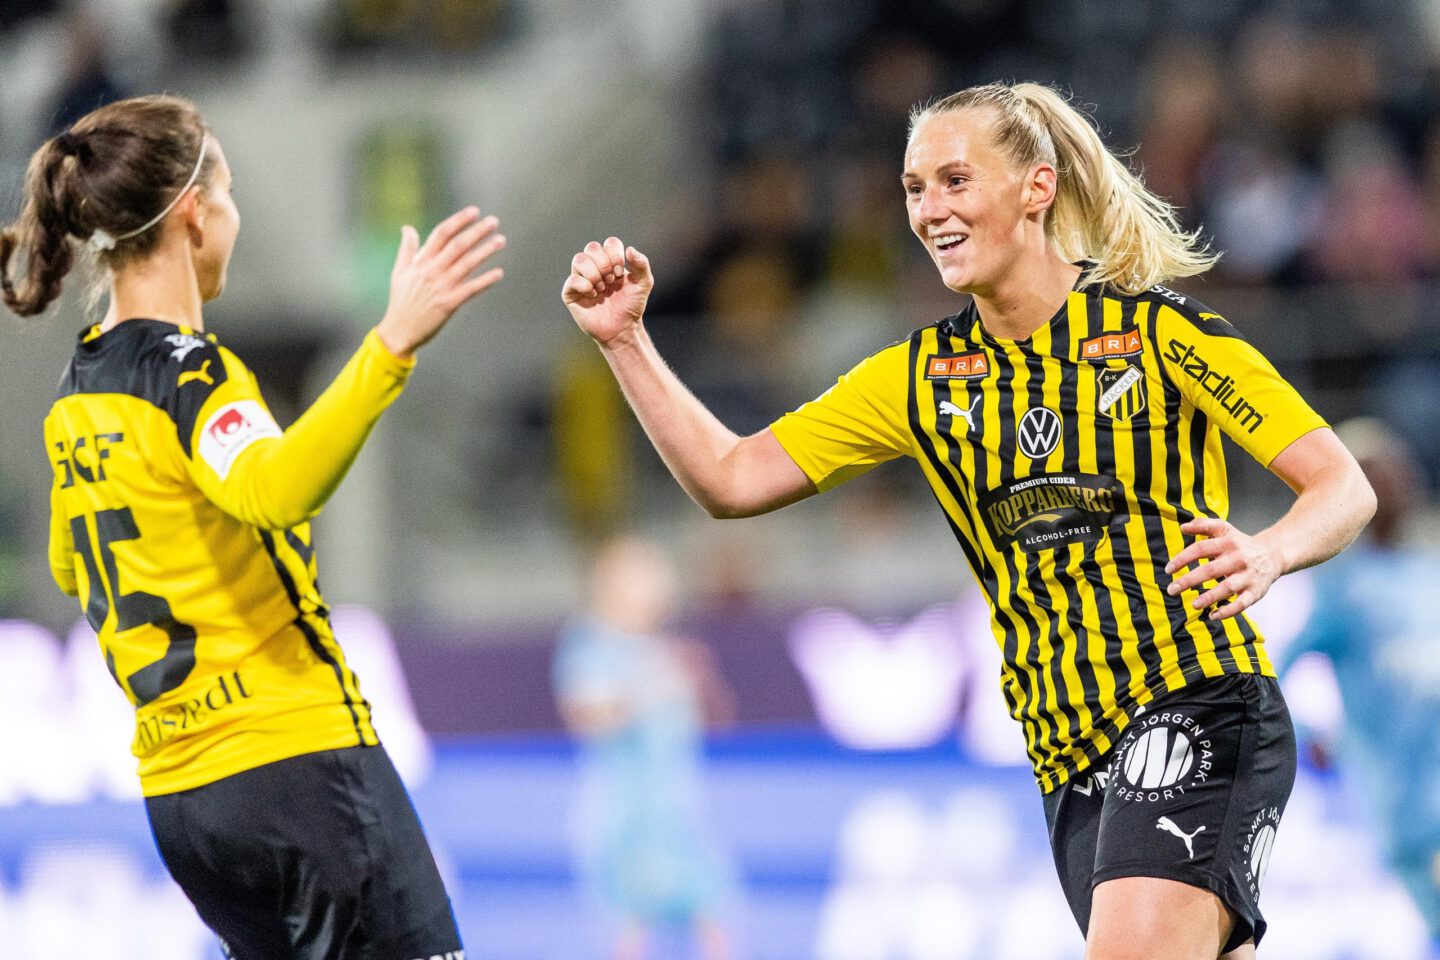
Stina Blackstenius has been the talk of the town in the land of the WSL. The Swedish striker has been linked with both Manchester United and Arsenal, with the latter having the biggest chance of signing here. Obviously, the striker has been doing well, but how was her shooting like in the 2021 Damallsvenskan? I will try to illustrate that in this article.
I will look at Blackstenius’ shots and analyse where they come from, how well she is doing, and whether she is a force to be reckoned with. I will do that by looking at the shooting metrics compared to her peers, but also investigating more into her shots. The data and video come from Wyscout and were retrieved on January 13th, 2021.
Data
Looking at shot quality can be measured in different things. In the scatterplots below I will look at the volume of the shots and the expected goals that are generated through the shots.
In the graph aboce you see the shots per 90 and shots on target metrics. When we look at this we see that Blackstenius does very well with 4,82 shots per 90 of which 42,7% go on target. She performs way above average in these metrics.
In the scatterplot above you can see the number of shots per 90 of a certain player and the expected goals per 90 of that particular player in question. The reason we look at this is how many shots a player has in a game and how high the probability is of scoring an actual goal.
In the shot volume, we can see that Blackstenius has 4,82 shots per 90 and the corresponding xG per 90 minutes for Blackstenius is 0,81.
In the end, the most important thing for a striker is his output: goals. I’m looking at the probability of scoring a goal with a certain short and looking at the actual goals scored by a particular player per 90 minutes.
Looking at the expected goals per 90 minutes we see that Blackstenius has 0,81 per 90 minutes, while as we look at the actual goals scored per 90 minutes, we see that that is 0,80 per 90 minutes. She is slightly underperforming but only with 0,01 per 90 minutes – which is insanely good.
In the graph below you can see the percentile ranks of Blackstenius compared to the 42 players in my database. This shows in which percentile he is for every metric that belongs to the shooting side of the game.
As you can see in the image above, Blackstenius scored very high in the shooting metrics. In the head goals per 90 she scores in the 72nd percentile, but in the shots per 90, xG per 90 and goals per 90 – she scored in the highest percentile: the 99th percentile. This means in terms of data she was the best striker of Damallsvenskan when looking at shooting stats.
Shot locations
Stina Blackstenius has scored 17 goals in Damallsvenskan 2021season from 103 shots in total. That is a goal conversion rate of 16,50%. The expected goal is 17,37 – which means that Blackstenius is slightly underperforming her xG with – 0,37. In the visual above you can see the shot locations of every shot attempted in the current season. In red, you see the goals, and in black the shots. The black dots correspond with shots on target, while the ‘x’ means a blocked shot or a shot wide.
Video analysis
In the last part of this shot analysis, I will look at four of Blackstenius’ goals which show different skill in each of the goals, and therefore shows the quality she has in this Damallsvenskan season.
In the video above you Blackstenius with BK Häcken in their game against Djurgårdens IF. This attack is not that direct, but it illustrates how Blackstenius likes to play on the off-side line and stay close to her marker, just before making a movement and having the space to create something. In this case she runs away from her marker, reaches the ball earlier than the goalkeeper and heads the ball over the goalkeeper in goal.
In the video above you seen Blackstenius with BK Häcken in their game against Rosengård. Not every attacking can be direct over the ground with dominant possession of the ball. Blackstenius is good at receiving the ball in the air and for the link up play as a target-woman. In this case she wants to receive the high ball, wins the duel and while she is out of balance, still manages to find the far corner with her right foot.
In the video above you Blackstenius with BK Häcken in their game against Växjö DFF. She is very good in the penalty area and can have close control of the ball to create space for herself and finish the ball. This is what she does in this example. She again knows how to control the ball and within a few touches knows how to set herself up and shoot. Her finish is outstanding in the way that she manages to put it in the top corner from a difficult angle.
In the video above you can see Blackstenius with BK Häcken in their game against Vittsjö GIK. This goal illustrates how Blackstenius can be instrumental in set pieces. The quality here lies in the way she gets away from her marker and gets that few centimeters she needs to attack the ball and head the ball in goal. The detail in the movement is what makes her better than other strikers in the Damallsvenskan.v
In this scouting piece, I’m going to look at Vitesse’ Loïs Openda. I wanted to have a look at a striker who isn’t at the traditional top-3, but is performing very well. In this piece I’m purely focusing on match data and event data, to make a more data scouting report without the video. I will also relate this to his peers
The data The data used in this analysis comes from Wyscout. In the dataset for the striker, I’ve selected each player who primarily plays on the striker position. Obviously, there are other players who have played in this position, but I’ve only selected the players that have played as a striker as a dominant position in the current season. This leaves me with 79 players who qualify in the Eredivisie 2021/2022.
Because I’m looking at the current season, which is a full season, I want to make a selection for players that played a decent amount of games for me to assess them. For me, it’s important that they played at least 600 minutes in this season. After looking at that I’m left with 42 players in my dataset and they will go through my analysis process. The data was retrieved on 23rd December 2021.
I will look at the following categories and metrics to assess their abilities through data:
Shots
Dribbling
Assists
Goals
Shots
In the scatterplot above you can see the number of shots per 90 of a certain player and the expected goals per 90 of that particular player in question. The reason we look at this is how many shots a player has in a game and how high the probability is of scoring an actual goal.
In the shot volume, we can see that Openda does quite well with 2,48 shots per 90 with an expected goal of 0,46 per game. Those two metrics are both above average as you can see. In the image below you can see Openda’s shot map of the 2021/2022 season with Vitesse so far.
Red = Goals, Grey = Grey
In the image above you can all shots, Openda had in the season so far. In those games, he has scored 10 times, twice from the penalty spot. He had 48 shots and a xG generated of 7,79 from those shots. With 10 goals scored, he’s overperforming with a number of +2,21 – a pretty good result. As you can see 9 goals came from within the penalty area, with only one coming outside of it. The sides are pretty evenly divided when looking at the goals, but in terms of shots, we can say two interesting things: he does shoot from distance more on the right side, but shoots from closer range on the left side.
Dribbling
Dribbling often is linked to wide midfielders of wingers, but it can be a valuable aspect of a striker’s game as well. The ability to control the ball, progress on the pitch, and deal positively with a 1v1 situation with an opponent defender, is not to be underestimated. Especially when you are not playing a typical central forward role, but playing with two strikers.
In the dribbles, we can see that Openda does quite average with 4,15 dribbles per 90 and a success rate of 55,7%. This does actually make him above average, but only just In the image below you can see Openda’s Ball Touch map of the 2021/2022 season with Vitesse so far.
In the image above you see the ball touches map of Openda in the opposition’s half. This is no dribble map, but it does illustrate where Openda gets the ball or touches the ball. In doing so we can see how much he’s closer to the midfield, how much he drops and plays deep – and how much he deviates from the natural striker position into the flanks. What we can conclude is that Openda does occupy the flanks a lot.
Passing
Expected metrics seem simple but can become incredibly complicated when combining things. In the scatterplot above I’ve taken a look at the probability of the pass becoming an assist per 90 minutes and looking at the actual assists of a player per 90 minutes.
In the assists, we can see that Openda does below average with 0,07 xA per 90 and actual assists of 0,06 xA%. As you can see he is performing below average and doesn’t really impress in the data. In the image below you can see Openda’s final third passing map of the 2021/2022 season with Vitesse so far.
In the image above you see all final third passes from Openda in the Eredivisie 2021/2022 – now this doesn’t say a lot about the actual performance, but it does tell us something about the successful passing of Openda. The passes to the penalty area aren’t that successful as you can tell by the red passes, but on the flanks and backward passes are quite successful.
Final thoughts Data analysis or scouting alone isn’t enough to fully assess the qualities of a player. It should always go hand-in-hand with video and/or real-life eye tests. But it does give us the tools to make shortlists and back up our findings with data. In this case, we can see that Openda does really well in the shooting metrics, but has been on average and below average in the dribbling and assists metrics. Depending on the profile you have for a striker, he could be included or left out. The most important thing to remember is that this never can be seen in isolation but always has to been in relation to something bigger.
As said before, there has been a lot of talk concerning the WSL. It has been a lot about the results of the English sides in the Champions League. But, domestically we see that Manchester United is doing remarkably well, but haven’t gottent the attention as they probably deserve.
In this analysis I will take Manchester United’s performance in the first half of the season and analyse their performances. I will focus on the following things:
Formation
Build-up & attacking style of play
Pressing style
In this analysis I will focus on the WSL 2021/2022. Data and video are from Wyscout.
Formation
According to Wyscout, Manchester United have played in three different formations: the 4-2-3-1 (74%), the 4-4-1-1 (15%) and the 4-3-3 (6%). Now these all have different ideas and principles, but for this analysis I will look at how they set up in the last 5 games, using these formations.
In the image above you see the 4-2-3-1 as employed by Manchester United. What characterises this particular formation is that you work with two specific blocks: a defensive one and an attacking one. The defensive block consists of the four-player defence Blundell-Turner-Mannon-Batille + the low defensive midfield or double pivot of Zelem-Ladd.
The attacking unit does consist of four players. Wide midfielders/wingers Toone and Staniforth with Risa playing on the ’10’ position, behind the striker. The lone striker in this situation is Russo.
In the 4-4-1-1 formation we see a shift in the positioning. There are two lines of four player, meaning that the midfield is strengthened and can play a deep 4-5-1 or 4-4-2 in defence if needed. In this scenario the double pivot is supported by wide midfielders and the difference with the 4-2-3-1 is that they don’t act as much as wingers
The attack is mainly formed by the two strikers up top, although seems like a striker and a shadow striker, the dynamics between the two is of vital importance, and they might shift from positions and roles.
We have no looked at the two main formations which make 89% of the formations used in this particular season. In the next segment we are going to look at how they build up with these formations.
Build up
In this part of the analysis we will look at the build up. With build up is meant the following: how a team progresses from their own goalkeeper or central defenders to the middle third in preparation for the attack.
In the GIF above you Manchester United building up from the back in their game against Everton. The build up start with the central defenders and the goalkeeper passing the ball to each other. There’s a mild press from the Evertonians, but Manchester United want to play out of it and try to circulate the ball in a high tempo. In doing so they have more time and this can be seen on the right flank, as they try to pass the ball to the right back who in this case wins the 1v1 one, inverts and has options in the half space in the middle third.
In the GIF above you see Mancheste rUnited in their game against Brighton and Hove Albion. In this footage we see a different way of buiding up. Manchester United reclaim possession of the ball and start building up with their central defenders. In this case they don’t opt for the direct, shot pass to the full backs – as they are not in the position to do so.
In this game Manchester United employed a 4-2-3-1 sistuation and encouraged full backs to go high, but also needed the double pivot to drop down to cover. The wide midfielders/wingers inverted in order to provide space for the full backs. When this was done, the central defender could play the long ball to the right flank, where the right full back made a run down the line in order to continue the attack.
In the GIF above you see Manchester United in their game against Leicester City. We see the central defenders on the ball and playing out from the back. Instead of doing that what has been done against Brighton, Manchester United did something slightly different.
The full backs did progress higher into the middle third, but not as high as in a different scenario. They stay a bit more conservative giving space to the wide midfielders/wingers to go wide. They do not invert, but go as wide as possible. The wide midfielders/wingers drop down as well to be able to receive the ball and that’s what happens here – and they will carry the ball into the final third.
Attacking style of play
Manchester United does create chances via their build up, as we have seen in the examples above, but in this egment of the article we are going to focus on the attacking style of play that involves their pressing. In the attacking third they press aggressively and that leads to possession in dangerous areas of the pitch for the opposition, which makes them a threat in those areas of the pitch.
In the examples below I will illustrate how they create goalscoring opportunities through their pressing.
In the GIF above you see Manchester United against Aston Villa. Aston Villa try to play it out from the back, but due to the agressive pressing from united on the full back an dthe defensive midfielder, they are able to regain possession of the ball in the central zones of the pitch and get the ball into zone 14, where Manchester United do shot on target. In this instance they could have carried it more into the penalty are, but they had space and time to hurt Aston Villa.
In the GIF above, you can see Manchester United in their game against Everton. The pressing starts with the striker who forces the goalkeeper/central defender to play it long to the middle third. When the ball is in the middle third, the defenders press the receiving player and hope to get possession of the ball again, after which the transition is done with great pace towards the left flank. The cross from that flank isn’t optimal, but does get to the striker who can get a shot on goal. In just a few passes, Manchester United is direct and gets in the right positions to harm the opposition.
Goals scored
So how do we go from creating a goalscoring opportunity to an actual goal? In the examples below you can see how Manchester United did that in their last few games.
In the video above you see Manchester United in their game against Aston Villa, as they used their pressing to get the ball in dangerous areas. They make use of 2 players pressing the player on the ball and used that twice, which ultimately ended up in getting the ball in the penalty area. A good move from the Manchester United player and a brilliant finish to top it off.
In the video above we see Manchester United in their game against Everton, while they have the ball in the middle third to start with. This attack is not the result of pressing, but does show us how many numbers Manchester United want to have getting forward. The ball goes to the wide midfielder who moves into the half space leaving space on the right flank. The right full back makes a run down the line, and is open to receive the ball when the wide midfielder passes the ball to the middle. Even though the central areas are loaded, Manchester United keep the ball and manage to find the the combination with a run, splitting Everton’s defence open and score a good goal.
In the video above we see Manchester United in their game against Brighton. They are in the attacking third and while Brighton applies a good press on the Manchester United players, they are managing to get out of it due to their technical abilities. High ball retention, technical ability and pace – meant that Manchester United was one step ahead and the ball went to the right flank, after which the cross was provided into the six-yard box. A smart finish guided the ball into the far corner, a good goal for Manchester United
Final thoughts
In this article I’ve highlighted some elements of Manchester United’s direct approach to attacks. They make sure to press high and get the ball to have goalscoring opportunities from there. They also know how to use their build up to swithc from the calm passes in the defensive third, to the high speed, direct play in the attacking third. This approach has been quite successful in the last few games and it’s interesting to see where it leads them, come end of the season.
I never thought I would write about Barcelona to be honest. So many people before have written about this club, but I thought that writing about their ‘B’ team would be quite interesting as they aren’t operating in a top 5 league, and it’s always good to see whether talents do well in a league that is full of senior players.
I will look more closely to how Barcelona B creates chances from zone 14 and I’m doing that by looking at video fragments of those chances in the 2021/2022 season in the Segunda Division B in Spain.
Zone 14
What is zone 14 and why is it important to many analysts? Spielverlagerung does explain it rather nicely:
“On a pitch divided into a six-by-three grid with a central strip as wide as the six yard box, the Zone 14, also called The Hole, has been classified as the rectangle which helps teams score more goals. Zone 14 is the zone located in the middle of the pitch immediately outside the opposing penalty area. During the 1990s and early 2000s, statistical data showed that successful teams such as the World Cup winning team of France or 1999 Champions League winner Manchester United had a better performance in Zone 14, as it was the key area which produced vast majority of passing assist. Until today, some prefer the concept of using Zone 14 as a target area in terms of build-up play, mostly denying the use of cross passes. According to various studies, the most effective way to use Zone 14 is to play a pass into the penalty area. Plus, the phase of possession in Zone 14 should not take longer than eight seconds.”
I like to look at zone 14 when I analyse teams. Not so much because I value zone 14 a lot, but I find it interesting to see which teams use that zone a lot and try to create goalscoring opportunities from there.
Chance creation: shooting
In the image above you see the pitch divided into 14 zones, which has been generated from InStat. In the current season, Barcelona B has created 82 chances, all of them in the final third. AS you can see chances have been created on the flanks, a stagger 71 chances within the penalty area and 7 have been created in that zone 14, we spoke about above. 8,54% of the chances were created from zone 14 and that’s what we are analysing in the next segment.
In the 3 videos above you can see how Barcelona B does shoot from zone 14. They often come in the situations by pressing the defenders, making sure that timing and place of the pressing is accurate, and regainin possession of the ball. In doing so they have 2-3 players in and around zone 14, which makes it easier to shoot from these locations. As you can see in the 3 videos above, the Barcelona outfit is quite successful when doing so in zone 14.
Zone 14 chance creation: passing
In the image above you can see the passes to the penalty area by Barcelona B per zone – this is a 14 zone grid. We see that the most passes come from the flanks, with 129 passes coming from the left and 102 passes from the right. As I’ve stated, I’m only interested in the zone 14 passes. In total there are 364 passes into the penalty area with 30 coming from zone 14, which is a percentage of 8,24%. Which is almost the same as the percentage for shots from zone 14.
What Barcelona B does very well in passing to the penalty area from zone 14 are two things. The first thing is that they want to dominate control of the ball in zone 14. They keep it in possession and try to play short passes within that zone to maintain control of the ball. The second thing they do well is that they try to look for that through ball or key pass that sets the attacking players up for a 1v1 or a good angle to shoot from. This isn’t always successful, but the intention is there and that’s why zone 14 can be very helpful in creating goalscoring opportunities.
Final thoughts
The main reason for creating this rather short article is to look at how Barcelona B does in zone 14 with chance creation. This is a very descriptive and quite obvious article, but it can also help in getting links. How do you use event data in combination with videos to analyse certain patterns of play? How do you contextualise and visualise chance creation?
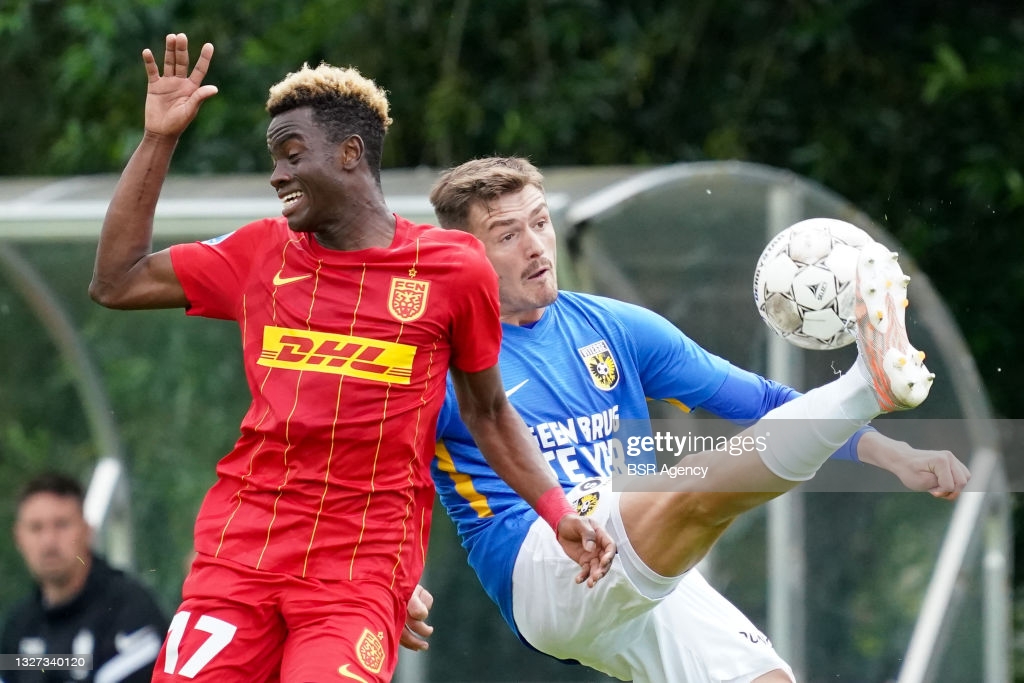
Today is the time for me to delve into a player playing in Denmark. There is a variety of talent in Denmark and I hadn’t taken a good look on my website at this league or the talents in it. I’m having a looking at this article at Nordsjællands’s Simon Adringra (19 years), focusing on his dribbles and shots.
In this analysis, I will zoom in on his attacking decisive actions during the 2021/2022 Danish Superliga in Denmark with the focus on dribbles and shooting stats from Wyscout/InStat data and then concentrating on some video fragments from Wyscout as well. In my dataset, I’ve chosen for all players playing on the striker position and have played over 600 minutes in the Superliga season. This leaves me with 26 players in my dataset to further go into the data analysis. I’m aware of the fact that often drifts to the left, but I wanted to analyse him in comparison to other strikers as he has played there a lot too.
Dribbles
In the image above you can see two metrics combined in a scatterplot. We look at the dribbles per 90 and the successful dribbles in percentages to look at two things. How many dribbles per 90 have been conducted per 90, and how high is the percentage of success at a particular player.
When we look at Adingra we can conclude that he has 9,92dribbles per 90, which is above the average among strikers of 4,06. When we look at the percentage of dribbles that are successful we see that Adingra has a success rate of 50,91% which is just above the average of 43,94%.
I want to know where his dribbles have occurred during the season. I’m not as interested in the carries and where he finished the dribbling, but from which positions he started the dribbles. In the image below I’ve looked at the starting position of all dribbles he has attempted during the season.
As described above, you can see all the starting locations of the 98 dribbles Adingra had in the season. Of those 78 dribbles, 50,91% were successful, that’s roughly 50 dribbles that are successful. He has the most dribbles on the left side, with a fair number of dribbles starting in the middle third, but most of them in the attacking third. Further, we can assess that a lot of his dribbles start on the left of which we will give two examples below.
In the two videos above in the game against Midtjylland and Silkeborg, you see Adingra making a dribble with the starting location on the left. He then proceeds to make a 1v1 action and invert in order to find a shooting opportunity for himself or to find teammates who are having a better chance of creating something or having a go on goal themselves.
Shooting
I’ve added the metrics above to the profile to assess Adingra, because he has been instrumental in being a threat in front of goal. That’s why I’m looking at his numbers in shots per 90 and how many threat does shot pose – what is the probability of a shot being converted into a goal. This can be measured with the expected goals per 90 metric.
Adingra does quite well in these metrics as you can see in his position in the scatterplot. He has 3,34 shots per 90 and 0,29 expected goals per 90.
In the beeswarmplot above, you can see 6 metrics to assess a striker. It tells us how good Adingra is compared to his peers in each of these metrics. He performs quite well overall, but in the Non-penalty goals per 90, goal conversion and xG per 90 – he does very well.
The shootings stats in themselves show us the number of shots or type of shots or anything data related to the shots. Adingra does very well in those terms, but in the next part of the analysis, we want to look at where the shots actually came from and what that does tell about the position Adingra attempts to score a goal. Does he generate his xG from a few big chances? Or does he accumulate his xG by shooting a lot of low probable chances?
In the image below, we can see all of Adingra’s shots taken in the Superliga 2020/2021 season. There are 37 shots of which 5 have gone in goal which is a conversation rate of 13,51%. The image shows us the shot locations of the last 37 shots during the season and I will attempt to analyse which are most frequent.
Simon Adingra has scored 5 goals in the Superliga 2021-2022 season so far and had 37 shots in total. That is a goal conversion rate of 13,51%. From those 37 shots, 48,6% went on target. In the visual above you can see the shot locations of every shot attempted in the current season. In red, you see the goals and in grey the shots.
What we can conclude from this visual is that all of the goals are scored within the penalty area on the right side. We do see that he often attempts from the left side but isnt successful from that flank.
In the videos below I will have a look at the five goals scored by Adingra, showing how he preys on mistakes made by the opposition and will punish them.
In the video above you see how Nordsjælland has a counter attack but only Adingra is up top. His pace and the space to chase the last defender, gives him an advantage and he wins the ball. After he has done that he sets himself up nicely and shoots the ball calmly past the goalkeeper.
In the video above we see Nordsjælland in a smiliar situation from the first video, as we see them starting a counter attack. This time the ball isn’t directly played to Adingra, but he makes a third man run, which proves worthy in the end. He gets the ball in the central zones and has time to finish in the penalty area. He scored at the near post.
In this game from Nordsjælland we see that the opposition doesn’t deal with a high ball from Nordsjælland. Miscommunication between the central defenders and the goalkeeper, means that Adingra can profit from the error and he does this successfuly, scoring another goal after an error.
A very similar situation to the previous goal. He manages to stay close to the central defender and scan the space between the two central defenders. In doing so he manages to get to the ball quickly when the error comes and ultimately has a good finish which beats the goalkeeper: goal.
In the video above we Nordsjælland in possession of the ball when they begin their attack. The long ball from the keeper is recovered by the opposition but they are not aware of how high Nordsjælland’s attackers are. Again Adingra, makes the most of the error and has an opportunity to score – and does this brilliantly.
Final thoughts
Nordsjælland always has very interesting prospects and the talent is undeniable. In the case of Adingra I wanted to see how this attacker managed to use the space with dribbling and how his end product is. I think there is a huge talent to seen in this footballer, but he needs to work on efficiency of his actions. He often gets caught in wanting too much with his dribbles or his end product lacks the comfort of scoring goals. Yes he does score goals after errors, but he finds himself in situations where he might score more. Even though he is outperforming his xG of 3,27 and 5 goals – but this can be even better for the young attacker.
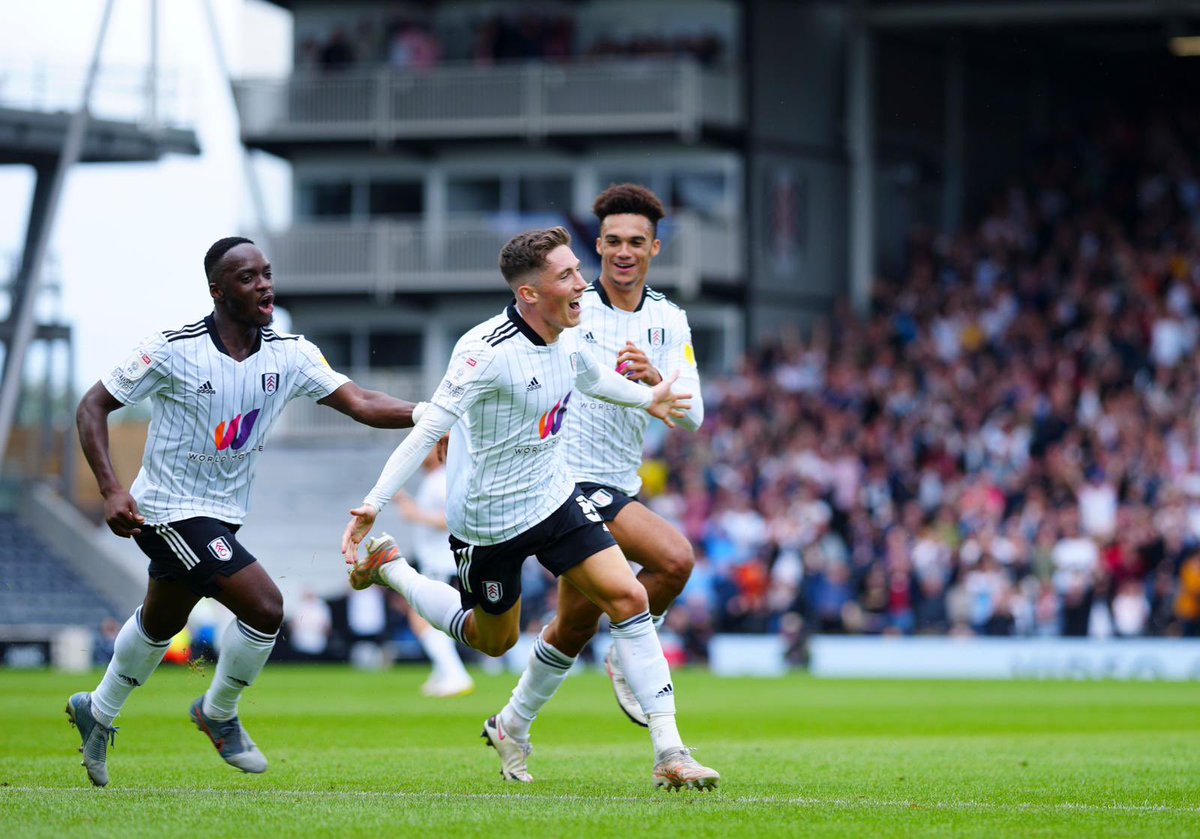
First day of December already? How time flies. In this first article of December, I will have a look at key passes. In particular, I will look at Harry Wilson’s key passes at Fulham in the English Championship 2021/2022 so far, and analyse how well he does compared to his peers.
In this article, I will analyse the key passing stats of Harry Wilson in 2021/2022 Championship. I will look at the data given by Wyscout and compare him to his peers, after which I will use visualisations and data to demonstrate his abilities.
I will use Wyscout data and video to assess how well Wilson does among all midfielders in Championship, performed in the 2021-2022 season. In the end, I will use video to look at some of his key passes in this season.
In my data, only players are concluded who have played on the midfield position and have played over 800 minutes. This leaves me with 160 players. I’ve made the decision to include all midfielders as they are prone to different roles over the midfield – in general – and therefore this will give me a better idea of how well Wilson is doing.
In the scatterplot below you can see how well he performs in the progressive passes per 90 vs passes to final third per 90 metrics.
If we look at the progressive passes per 90, we see that Wilson has 4,47 progressive passes per 90, in the 2021-2022 season in Championship. Wilson has 2,59 passes to the final third per 90. He performs below average when we look at progressive passes per 90, and also performs under average when we look at passes to the final third per 90.
If we look at the Passes to penalty area per 90, we see that Wilson has 3,41 passes to penalty area per 90, in the 2021-2022 season in Championship. Wilson has 1,24 through passes per 90. He performs on average when we look at through passes per 90, and on average when looking at passes to penalty area per 90.
In the image above yousee Harry Wilson from Fulham, compared to midfielders in the 2021-2022 Championship. This shows us the rank of his key passing data compared to his peers. He doesn’t do well in the passes to final third and progressive passes, but in every other metric, he scores in the 75th percentile and up. If we exclude the through passes, we can see he even scores 85th percentile and up.
This can also be seen in the beeswarmplot below. This visual shows us the same information, but the visual is slightly different as it visually shows us where the players are in terms of the metric and shows us how far ahead Wilson actually is. Or isn’t.
Now I will look at the passes from the last 4 games Wilson has played in Championship: Peterborough United (A), Barnsley (H), Derby County (H) and Preston North End (A). I will look at his heatmaps and pass maps to establish where he was and where passed the ball.
In the images above you can see where Wilson operates in these games. In all games he operates on the right side of the pitch with the game against Derby being slightly different, as he also played more centrally. In defence he covers that same flank, but going torward he tries to also invert and occupy the half space, which makes hum a good option in creating chances. Those passes created from there, can be seen in the image below.
In the images above you can see where Wilson passed the ball on the opponent’s half to see how Wilson contributes in attack when he progresses on the field. He is very present in the game against Peterborough, but less so in the game against Preston North End.
Video analysis
In the three fragments below you can see three key passes that Harry Wilson made in the last four games. It illustrates the way he contributes to the Fulham side and where his key passes come from.
In the video above you see Wilson on the right flank, initially combining and after saving the ball from going behind. In doing so he creates space by surpassing the opposition’s defender and scans his surrounding for a good option to pass the ball to. He doesn’t opt to give the ball into the six-yard box, because it’s too crowded. Instead, he cuts it back to the player outside the six-yard box, who then attempts to shoot on goal. A good shot assist by Wilson.
In the video above we see Wilson picking up the ball on the right flank. He shows his technical skill to hold on to the ball, use his body and invert towards the middle of the pitch. He comes into the central areas of the pitch and in doing so the strikes react to his run, and make their movement forward too. His through pass is perfect for the striker as it sets him in a 1v1 against the goalkeeper.
In the video above we see Fulham with a throw-in and the movement from Wilson is quite good. He receives the throw-in and immediately passes it on to a teammate, whilst getting into the space at right wide midfield. He comes to the flank from the middle and that movement creates space for other players to go into, as can be seen by the player who shoots.
Final thought
Harry Wilson is a player we all talk about a lot because of his history with Liverpool. We keep asking ourselves what his full potential is and in this analysis we have looked at just a small part of his talent, but it’s an important one. He does very well in the data and creating opportunities for his team is what he does well. If he keeps progressing like this and keeps on being important, he will be in the Premier League.