ALEXIA PUTELLAS – SHOT ANALYSIS

I’ve promised myself not to choose any players to analyse who are aesthetically pleasing in their game. I wouldn’t. However, in this article, I will analyse a player who is equally aesthetically pleasing to the eye in terms of her game, as well as one of the top players in the world: Alexia Putellas. UEFA player of the year and part of the UWCL winning Barcelona side.

That was easier said than done. I usually use a lot of data to incorporate into my analysis, but there’s not much data available in the Primera Iberdrola which makes it incomplete and analysis via data is quite impossible. Well, not impossible but it does give a wrong representation of reality. In light of that, I’ve chosen to look at the shots by Putellas as well as her chance creation.

The data and video uses are from the 2021/2022 season and will involve the Primera Iberdrola, the UWCL and the Spanish National team. This has all been retrieved on 30 October 2021.

Biography

Alexia Putellas Segura was born on 4th February 1994 in Mollet del Valles, Spain. He was raised/educated for the most part in Espanyol academy before moving to Barcelona and has played there since the 2012/2013 season, for the first team. In this particular season Putellas has played in 12 games in the league, UWCL, World cup qualification games with Spain and friendlies. Putellas has scored 12 times.

Shots

In the image above you can see Putellas’ shotmap of the season so far. There are 48 shots conducted, but some shots have been done from approxiamtely the same location, hence only 42 are visibly plotted. Of those 48 shots, 12 were converted into a goal – as you can see above (red=goal, grey=shot). 5 shots were blocked, 16 shots were wide and 27 shots were on target. Putellas’ conversion rate from to shots to goal is 25%.

When we look at expected goals we see that Putellas has an xG of 8, with an xG per shot of 2,6 in total. Her actual goals are 12, so she’s overperforming her xG by 4.

Putellas averages 4 shots per game this season and 1 goal per game this season, which is quite prolific for any player, but especially for a midfielder. Sidenote to this, Barcelona is by far the best team in the league at the moemnt – but still very impressive. It’s quite early in the season to be make any representative conclusion, but the fact remains that Putellas has had a terrific season so far.

If we look at the locations of the goals, you can see that 9 goals have scored within the penalty area, 2 on the edge of the penaly area and 1 deep on the half. In the videos below, I will use video to demonstrate some of the varied goals she scored.

In the video above we see Barcelona in their UWCL game against Arsenal where Putellas scored the 2-0. In this situation she progressed as the player in the central zones in which she assumes to come on the end of the cross from the flanks. In different strategies to strikers, she doesn’t sprint herself to come in the six-yard box, but does arrive a little late – giving herself time and space in front of the goal. She gets the ball as a cut-back and as result of that she can score the goal quite composed.

In the video above you can see Putellas in the game with the national team of Spain against the Faeröer. In this specific example we see her receiving the ball on 20 meters from the goal and this illustrates how she’s aware of where the goal and the opposition is. She brings the ball slightly more to the middle, beating three opponents in the process after which she places the ball into the far corner. The effect and the bounce the shot has, makes it even more difficult to get behind it for the keeper.

In the video above you can see Barcelona in their game against Valencia. In this particular example we see Alexia again in zone 14, where she does combine with hear teammate, before getting it back and beating a defender. In doing so she creates space for herself to the left and that angle gives her a good chance of scoring this goal. She does shoot in the far corner and low, giving the goalkeeper no chance of saving this.

In the video above we see the Spanish national team against Ukraine, with Spain having an attacking from the right. The cross cannot be attacked by the most forward players, but the second ball is for Alexia. She progresses herself to the position on the edge of the six-yard box in order to always be in the area of where the ball will come. Eventually, this means that she can finish the second ball and scores again.

In the video above we see Barcelona in their game against Villarreal. The forwards will go into the penalty area, but Putellas does arrive late into zone 14 and makes herself available for a pass without being pressed instantly. She gets a hard pass with her body focused on the right flank, but turns and opens her body towards the goal and in doing so, swiftly makes herself ready for a shot. She managed to get her body low and behind the ball, and scores a very good goal with her left foot, outside the penalty area.

Final thoughts

Alexia Putellas is an amazing player and can dictate the midfied with her runs and passes, but her added quality can be found in the way she shoots, the quality of her shots and the ease she uses the technique to score goals. She arrives in zone 14 a lot and there is where she executes her passes and tries to score – if she keeps arriving in that particular zone, she will have many more goalcontributions in the rest of the season.

JACK HENDRY – KEY PASS ANALYSIS

The Jupiler Pro League has established itself from a lesser-known league to a relevant league with huge talents, progressive clubs, and a ground for young prospects to develop themselves. In this article, I will look at one of those players that has grown in the league: Jack Hendry.

The player moved to Club Brugge this summer which sees the Scotsman be on the national top in Belgium and participating in the Champions League. In this analysis, we will focus on his key passing during the ongoing season.

I will use Wyscout data and video to assess how well Jack Hendry does perform in the 2021/2022 season so far. In the end, I will use video to look at some of their through passes in this season.

If we look at the progressive passes per 90, we see that Hendry has 5,78 progressive passes per 90 in the 2021-2022 season in the Belgian Jupiler Pro League. When we look at the passes to the final third per 90, we see that Hendry has 4,84 passes to the final third per 90. In terms of performances against his peers, he has average stats as a central defender, but he is definitely not the worst in terms of those metrics.

If we look at the key passes per 90, we see that Hendry has 0 key passes per 90 in the 2021-2022 season in the Belgian Jupiler Pro League. When we look at the through passes per 90, we see that Hendry has 0,28 through passes per 90. In terms of performances against his peers, he has below-average stats as a central defender. For a central defender that many passes forward and to the final third, his actual key passes are not included in this season – he didn’t attempt them according to Wyscout.

In the image above you Jack Hendry from Club Brugge, compared to central defenders in the 2021-2022 Jupiler Pro League. This shows us the rank of his key passing data compared to his peers. He scores way below average on most metrics, only three metrics are in the region of average: Assists per 90, xA per 90 and passes to the final third per 90.

Now I will look at the passes from the last 4 games Hendry has played in Jupiler Pro League to assess his passing qualities: Charleroi (A), OH Leuven (H), Anderlecht (A) and Antwerp (A).

These are the last four games played by Jack Hendry in the Jupiler Pro League with Club Brugge. These colormaps show us where Hendry operated in those fout games and give us a heatmap of the central defenders. As you can see in all of the maps, Hendry is a progressive central defenders who loves position himself high up his own half to progress the play as directly as possible.

This can also be seen in the passmaps of Hendry during those four games, which can be seen below:

You can see the passes conducted by Hendry in the games against Charleroi, OH Leuven, Anderlecht and Antwerp. You can see that he likes to pass to the right, especially to any right back making runs down the line or wide midfielder. He attempts to reach those players on the flanks and usually tries to attempt a progressive pass: the passes progress the play and it means that the ball will go from the defensive third to the middle third, initiating attacking sequences.

Video analysis

In the four fragments below you can see four different types of passes that Jack Hendry has made in the last four games. It illustrates the way he contributes to this Club Brugge side and where his passes come from.

In the video above you see Club Brugge in their game against OH Leuven with Club Brugge in possession of the ball. They are dominant on the ball and that means that their back four will have a high line. By doing so the quality on the ball of the central defenders need to be there. Hendry gets the ball in the middle third and his pass here isn’t progressive in terms of meters, but his pas leads to the next phase of the build-up: constructing the attack. That pass is positive in the sense that it doesn’t go to a left/right back.

In the video above you see Club Brugge in their game against OH Leuven with Club Brugge in possession of the ball. They are dominant on the ball and that means that their back four will have a high line. By doing so the quality on the ball of the central defenders need to be there. This is a similar kind of pass going forward, but Hendry immediately receives the ball back and looks for the long pass to the left flank in order to go the attacking third on the flank.

In the video above you see Club Brugge in their game against Charleroi. Again, Club Brugge is dominant on the ball and play with a high defensive line, which means that Hendry gets the ball in the middle third. In the aforementioned examples he progresses the ball through the central zones, but this time he progresses it via the flank on the right. This is a good pass, because it’s not sideways, but moves the play into the attacking third via his right back.

In the video above you see Club Brugge in their game against Charleroi. Again, Club Brugge is dominant on the ball and play with a high defensive line, which means that Hendry gets the ball in the middle third. This time Hendry is put under pressure by the opposition’s pressing, but he remains calm and still executes a pass through the central zones, which potentially can lead to another positional attack.

Final thoughts
Jack Hendry has moved to Club Brugge over the summer and some people have questioned his ability to keep up with the level that is asked of him. Looking at the data and video, one can say that he’s doing reasonably well so far, but he has not been outstanding – however, if his key passing can progress, he might be one of the better players for the club in the near future.

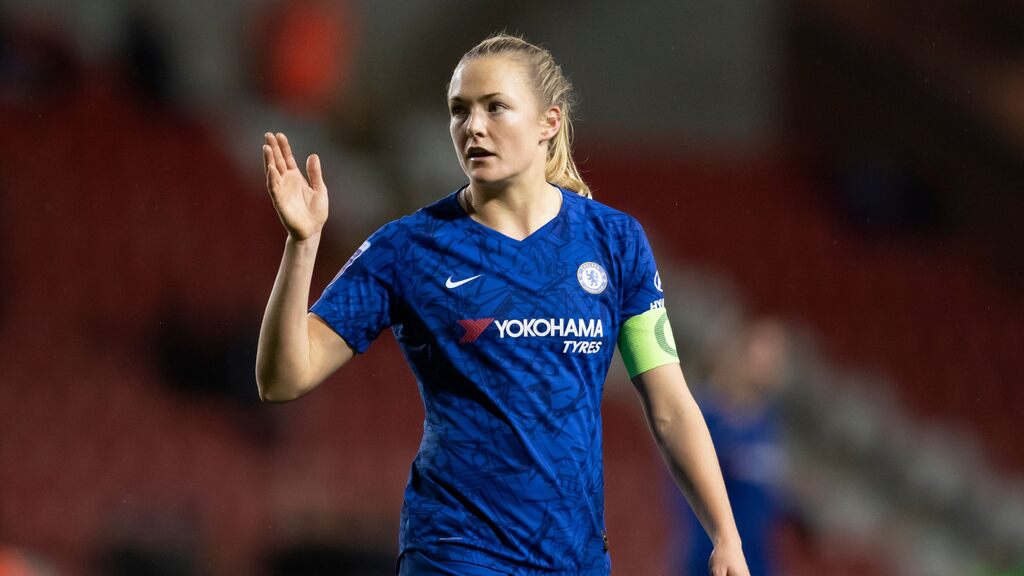
MAGDALENA ERIKSSON – DEFENSIVE ACTIONS

In my opinion, what deserves more attention, is the way we scout/recruit central defenders. They aren’t as popular to write about as strikers, because goals add more to entertainment value – that’s also why it is harder, as you quantify their qualities in a different way. In my experience, it’s harder to look for a good central defender, but it’s incredbily satisfying to find the perfect fit for your team.

In this article I will not look at recruiting someone for a team, but I will look at what a good central defender can contribute to a team, with the idea that that certain profile can be used for recruiting a similar player. As an example I will look at Magdalena Eriksson, a central defender from Sweden playing for Chelsea Women.

In this analysis, I will use data and video to look at her performance in the WSL with Chelsea. The data has been retrieved from Wyscout and will contain the data from the year 2021, as the WSL hasn’t had many games in the current season, and therefore it won’t give us a good representation of the performances. The videos are from Wyscout and are from this particular season.

Defensive duels

In the graph above you can see how the central defenders performed in the defensive duels metric. This tells us how many times they engaged in a defensive duel and how high the percentage of wins was in those defensive duels per 90.

Magdalena Eriksson had 3,51 defensive duels per 90 in the 2020/2021 season with a win percentage of 64,79%. When comparing that to others in this specific position, she scores below average on both metrics. Now, this is not the whole story, because not every defender gets in the same position.

In the videos below you can see how she conducts herself in defensive duels during the current 2021/2022 season and what the consequence was of that.

In the videos above which only contain clips from the game against Manchester United, you see Eriksson marking hir direct opponent after which she engages in a defensive duel. She marks her opponent closely and when the ball comes to one of the attackers, she manages to get in front of the attacker with her head or one of her feet, in which she attempts to get the ball aways from the attack and give Chelsea the advantage in a possible transition.

Aerial duels

In the graph above you see the aerial duels per 90 vs aerial duels won in the 2020/2021 season in the WSL by central defenders. We use the metrics to measure aerial capability in terms of defending.

Magdalena Eriksson had 4,21 aerial duels per 90 in the 2020/2021 season with a win percentage of 61,18%. When comparing that to others in this specific position, she scores far above average on both metrics.

In the video below you can see a few aerial duels conducted by Eriksson.

Her aerial duels tell a lot about her strength in the air. She knows when to jump, times it correctly and uses her strength to win the aerial duels. Winning is one part of an aerial duel, but converting it into ball possession for your own team is even harder. In the examples above, she does very well.

Interceptions

In the graph above you see the metrics PAdj interceptions and PAdj tackles combined. They show us how many tackles and interceptions have been made by the specific players, while these stats have been possession adjusted.

As you can see, Eriksson does pretty well in the interceptions part of the graph with 8,29 interceptions. On the part of sliding tackles she scored below average with 0,23 sliding tackles. Interceptions tell us the story of anticipating an opposition’s action, while sliding tackles are the actions that are needed as a last resort.

Eriksson does really well with interceptions, as you can see in the videos above in the games against Arsenal and Manchester United. It isn’t only recognising where the pass will go, but also blocking passing lanes. It’s about stopping the opposition’s attack, but also about starting a transition – Eriksson does it well.

1v1

In the videos below we will look at the 1v1 situations Eriksson was in the WSL games of this season so far. We can see if she engages in a tackle or forces them to go to a less threatening situation.

Earlier, I had a look at the defensive duels and the interceptions, but in the examples above you see the 1v1 defences. In the first two videos we see that Eriksson marks closely to her direct opponent, but that does that too close to the opponent, which leads to the attacker gaining the advantage. Covering the ground is very hard for a player like Eriksson.

In the third video, this is different. She does keep er distance but forces the attacking to seek for an opportunity. Engaging in this situation will lead to 1 on 1 with the goalkeeper or giving away a free kick, which both could prove even more threatening.

Final thoughts

In the few examples above we have seen the defensive actions of Magdalena Eriksson both in the data and video. Magdalena Eriksson is a true leader and loves the physical confrontation with her direct opponent. This means that she is good in aerial duels, defensive duels on the ground and intercepting passes. This also means that the nature of her way of playing, can lead to spaces behind her which the opposition can utilise.

ANNA PATTEN – SCOUT REPORT

For someone who loves defenders, I’ve written remarkably little about them. This is about to change, hopefully. In this article I will look and analyse Anna Patten of Arsenal. She’s a very interesting player and perhaps somewhat underrated in terms of attention and importance, but the young defensive player could prove to be an instrumental part of Arsenal’s success in the coming years.

This analysis will focus on her defensive abilities as well as her contribution to Arsenal’s attack and the videos will concentrate on her games in the WSL 2021-2022 and the UWCL 2021-2022. The footage is from Wyscout and is retrieved at 28-09-2021.

Defensive positioning

Defensive positioning is a metric in which we measure the ability to cover ground and defend a certain space in relation to other teammates, the opposition, and the pitch as a whole. In the examples below, we see defensive positioning as done by Anna Patten.

In the three examples above, you see Anna Patten in Arsenal’s game against Reading. What she does well in these examples is that she scans the options the attacking side has and what she needs to do in order to disrupt their attack or minimalise their threat.

She uses her pace and strength to stay ahead of the attacking player she has to mark and does anything in her power to trail back when she is higher up the pitch and a transition from attack to defence occurs. She keeps a relative distance to her direct opponent but closes in as soon as the ball enters her specific zone or when the balls seems to go to her direct opponent.

1v1s

In this part we will analyse the 1v1s by Anna Patten. We can see in these videos how well she performs in terms of duels, but also how she prevents or takes advantage in a 1v1 situation. This can be through positioning, defensive action or by using the space available.

Patten is very eager to close the opponent down, but in her eagerness, she sometimes chooses the wrong moment to have a defensive action. That leads to the ball being passed through her legs, or not being able to use her body well to regain possession of the ball. She has the qualities to do so, but it’s all about the timing and the place where you do so.

In terms of pressing an opponent, she does very well, as can be seen in the third video in the game against Chelsea. She has a run at the opponent and makes it difficult for her to get forward by blocking passing lanes and forcing to pass it back or sideways.

Interceptions

In the next few examples, I will look at the interceptions made by Anna Patten. These show us that she recognised a pass and acts on it, by getting in front of her opponent and start a transition from defence to attack. Not in all cases though, sometimes it is blocking a passing lane and it results in a set piece situation.

Patten is good at recognising where the ball will be passed too. By knowing this she can choose the right time and place to make that interception. This can also be seen in the videos above where she gets possession of the ball or her teammates get possession of the ball, after a decisive action on her part.

It’s an integral part of a modern full back and/or wing back to possess these qualities. An interception is not just making an action and getting the ball at your feet, but it’s also making sure that your team can progress because of it and that’s what Patten does very well in the games watched.

Crosses

As stated above, an integral part of a full back or wing back is to progress on the pitch, but also to contribute to an attack by an action. Crosses are very important, because that means that the flanks are utilised and more people can attack said cross. In the examples below you see videos of crosses by Anna Patten.

In these five examples you see the crosses by Patten. She possesses over the ability to get into the right position to give the crosses from both the right and left flank, spots the runs and gets the ball into the right area. When the attacking players connect with it, the crosses are very effective and give for dangerous situations.

The pace and power behind the crosses could be better, but that’s compensated by the fact that the accuracy and placement of the crosses is sufficient to create danger in the penalty area, as seen in the videos above.

Through pass

Besides crosses, through passes are very useful to have in our arsenal. Patten doesn’t attempt those through passes a lot – but she possesses the ability to do so.

In the video above you see how Anna Patten gets the ball and immediately thinks progressive and spot the runners. She looks for the combination and on receiving the ball she gives a through ball, which splits the defence and gives Arsenal the possibility to be a big threat in the final third.

Final thoughts

Anna Patten is a very interesting player and perhaps a player who isn’t in the primary conversation when talking about world class players, but she has a lot of potential. With Arsenal stepping up in terms of performances under their new head coach, this might well be good for Patten – as she can lift on that particular success. If she finetunes her eagerness and anticipation, she could reach very high levels.

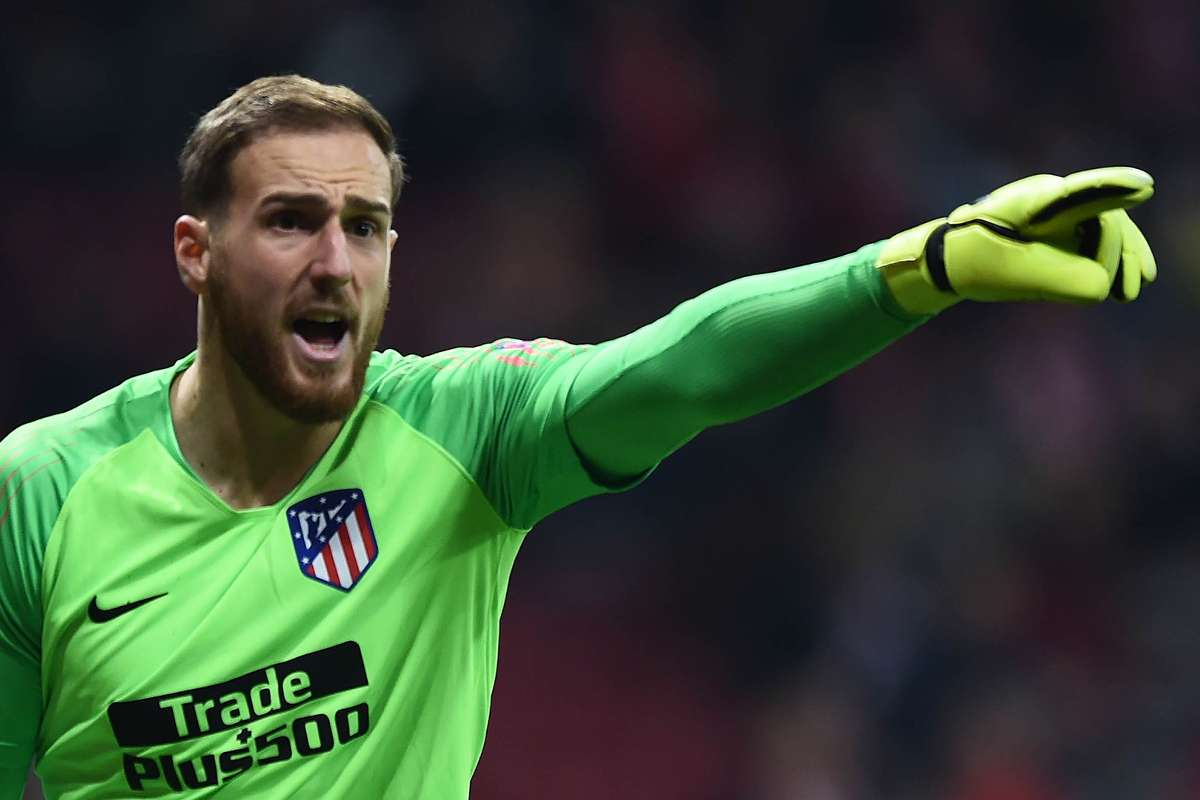
JAN OBLAK’S PERFORMANCES 2016-2021 – PART I: 2016/2017

If goalkeeping is an art, surely Jan Oblak’s performances in the past 7 years will feature as centerpiece in the museum. Jan Oblak has been instrumental to Atletico de Madrid’s success and their defensive performances. In this analysis the focus will be on Jan Oblak’s performances from the 2016/2017 season to the 2020/2021 season, the latter seeing Atletico crowned champions of Spain.

In this analysis I will focus on a few things. I will use data to assess how well Jan Oblak has been doing in the 2020/2021 season in comparison with his peers and I will use data in general to illustrate the performances in numbers. Next to that I will look at video to assess his abilities on the line, leaving the line and the ability to give a long ball. The data and video used in this piece come from Wyscout.

This will be a five-part series with today starting with 2016/2017 season with Atletico de Madrid.

2016/2017

Jan Oblak played 30 games in La Liga of which 15 games resulted in a clean sheet for the goalkeeper, that’s exactly 50% of the games. He played 11 games in the Champions League in which he had 6 clean sheets, resulting in a percentage of 55%.

In the graph above you can see four metrics by which we can measure the data performance of Jan Oblak. In this particular season, Jan Oblak had 89 shots against in La Liga by different teams. The quality of the shots and the probability of them being converted into a goal would suggest that 25,26 would result in a goal – which is 28,38% of the shots. In reality, Oblak conceded 21 goals in this La Liga season, which means that he’s overperforming by 4 goals less conceded than thought.

He concedes 0,69 goals per game in this particular season, making him the best performing keeper in this sense that has played over 30 games that season. It’s not completely foolproof as this doesn’t incorporate the likeability of a goal being scored or how well the defence has performed, but Jan Oblak did extremely well in this metric.

Saves with reflexes

In the video below you see Atletico de Madrid conceding an attack against Real Betis. A cross from the left is cut back and the Atletico defence doesn’t deal with it properly leaving it to be a shot for Betis. The volley is guided to the far post within the penalty area and it needs a swift and strong response from Oblak. Not only to keep it out but also to push it sideways, so that the opposition can not profit from a rebound.

In the video above we see Atletico de Madrid conceding an attack against Espanyol to the right. The ball is not dealt with properly and Espanyol can take control of the ball and attack with 5v7, but make the most of the situation by going to the right side of the penalty area. It seems like a free shooting opportunity for the home side, but the actions by Oblak make it very difficult for the attacking side. He rushes out from his line in order to make the goal smaller for the attacker. Combined with his reflexes after a hard hit shot, he makes sure to save this particular shot and make sure the instant danger is gone.

In the video above you can see Atletico de Madrid conceding an attack to the left from Real Madrid. Real Madrid combine through the central zones, setting up Benzema in the middle to shoot on target. This doesn’t seem like too difficult a shot to save when you look at the angle, but the reflexes in this case are quite good. When facing a shot from that close range, you will have to bet which side the ball will go. Oblak initially chooses another side, but in his reflex manages to block the ball still, and saves it.

In the video above we see Barcelona having an attacking corner from the right which swings out, meaning it will be more difficult to leave the line and makes the most of the ball, for Oblak. In this case, the ball goes to a Barca player who heads the ball to the far post and to the ground. What makes it difficult to save the ball is that you need to time your dive well otherwise the ball will bounce off you or go underneath you. And, secondly, the ball had such speed and force, that it needs strength from the keeper to get the ball behind his body and make sure it’s saved before the goal line.

Leaving the line

Above we assessed Oblak’s performance and technique while on the line or with reflexes. Another aspect of a goalkeeper’s game is to assess whether he/she can leave the line and clear the ball after a cross, corner, or freekick.

In the video above we see Villareal with a freekick against Atletico de Madrid and it is taken from the right. The ball swings out but will go near to the six-yard box into the goalkeeper zone. In these moments you have to be certain of your decision. Oblak is determined to punch the ball away and does that convincingly. If he had hesitated and not fully committed to this ball, Atletico de Madrid would be very likely to concede from this freekick.

In the video above you can see Oblak defending a corner from the left, which eventually leads into a high cross into the goalkeeper zone. Because the ball is traveling a long time, it’s easier to anticipate and due to the aerial height of Oblak, he can catch it quite easily.

In the video above you can see Atletico de Madrid in the game against Real Madrid when a cross comes from the left. The cross goes deep past the far post zone, but it could be a dangerous situation if Real Madrid wins the first contact. Oblak really needs to get hold of the ball because otherwise the goal is empty and the opposition can make the most of the situation. He rises high and gets to the ball, which allows Atletico de Madrid to start building their attack again.

In the video above you can see Atletico de Madrid in their game against Real Sociedad when they have a cross from the left. It’s again a high ball that gives Oblak the time and space to execute his action. In this case, the defenders prevent the attacking players from progressing up the pitch, leading to an easy save.

These are some of the characteristic saves by Jan Oblak which we have seen over the past few years. My mission is to look at some of the same sorts of saves in later seasons and see if there is a continuation of technique or that he has evolved and tried new things. We will start the comparison in the next piece when we look at the 2017/2018 season of Jan Oblak with Atletico de Madrid.

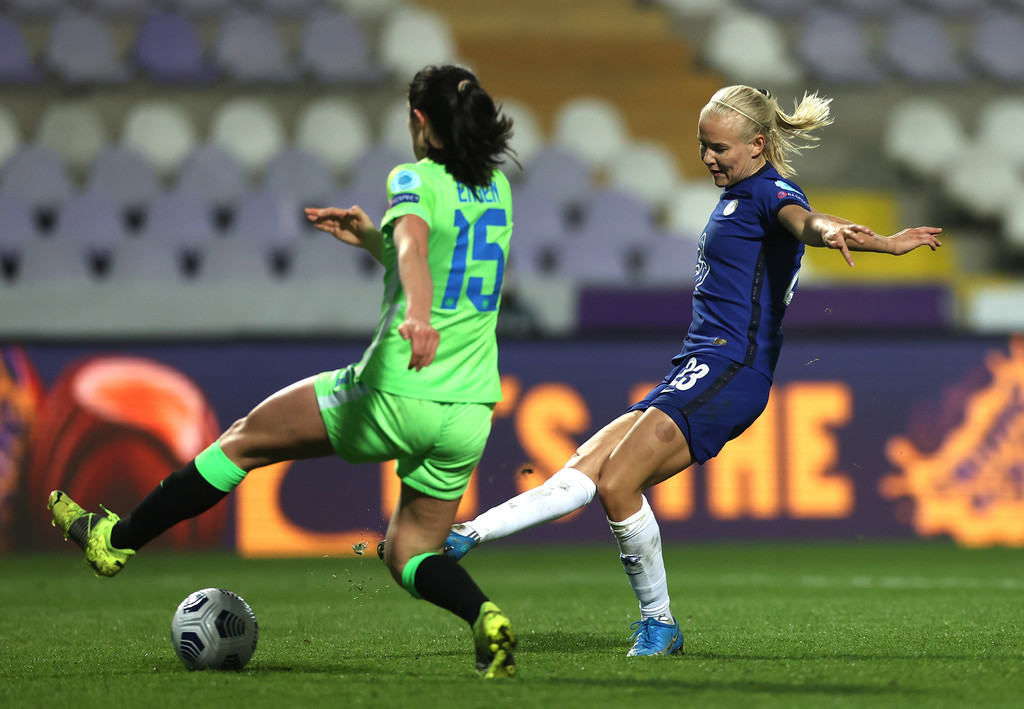
PERNILLE HARDER: ATTACKING NUMBERS & THROUGH PASS ANALYSIS

I’ve always felt unequipped to write about women’s football. Not that I don’t possess the knowledge about football, but that I don’t feel that I know the depts of women’s football enough to make an assessment. Or that people just didn’t want to hear about my thoughts about it.

I’ve let that thought go a bit now, but this is my first player analysis in the women’s game – and because the fact that I liked doing them on the men’s game, this will be equally fun for me. In this analysis I will look more closely to Chelsea FC’s Pernille Harder – more specifically, her attacking numbers in the WSL and her through passes in the 2020/2021 season.

Data analysis

In the data that I’m using all players that have played in the central attacking position in the Women’s Super League, 2020-2021 have been included. The reason is that Wysocut has set this as such, so that’s how I’ve taken it on. I’ve filtered them for >900 minutes played, as that’s enough, in my opinion, to make a good judgment on their data performances in the league. This leaves me with a total of 27 players to look at in data analysis. The data and videos have been retrieved on May 5th 2021.

Goals

In the scatterplot above we can see the metrics shots per 90 and shots on target % combined. It tells us how many shots are conducted per 90 and how well these shots are places – are they on target or not? Harder has 4,03 shots per 90 in the WSL this season with shots on target percentage of 40,35%. As seen in the image, you can see that only Kerr and Miedema have more shots per 90 minutes.

In the scatterplot above we can see the metrics expected goal per 90 and goals per 90. It tells us how big the probability of a shot being converted into a goal is and the actual goals being scored per 90. Harder hasa xG of 0,61 per 90 minutes with 0,64 goals scored per 90 minutes. This means that Harder scores more goals than would be expected on the quality of chances and shots. Only Foord, Miedema, Kirby and Kerr score more goals per 90.

Pernille Harder has scored 20 goals in all competitions in the 2020/2021 season. In the Women’s Super League she has scored 9 goals with 1273 minutes played so far. In the video below I will show some of the goals that show how clinical she is and how she always comes in the right positions to score goals for Chelsea.

In the video above we see Chelsea in the attack on the right side with Harder in key role in the attack. She is constantly moving and scanning where the ball is and when the opposition doesn’t clear the ball sufficiently she steps up in the penalty area and with a piece of skill gets in an ideal position to score, which she does.

In this video we Chelsea attacking on the left side in the game against Arsenal. In this video we see that Harder positioned herself just outside the penalty area before penetrating that penalty area. The little movement she makes to get just enough space to get a good shot at goal, is what makes her an elite player rather than just a good player.

The movement is a key part of Harder’s game. In this set-piece above we see that she starts close to the six-yard box, but then drops deeper and deeper, just outside the penalty area, in order to get the ball and give herself enough space to adequately pull the trigger. This time she shoots with her left and her shot is precise – another goal for her.

Assists

In the scatterplot above we can see the metrics expected assists per 90 and assists per 90. It tells us how big the probability of a pass being converted into a goal is and the actual assisted being scored per 90. Harder has a xA of 0,2 per 90 minutes with 0,21 assists per 90 minutes. This means that Harder has more assists than would be expected on the quality of chances and passes. Only Foord, Miedema, Kirby, and England have more assists per 90.

Pernille Harder has assisted 7 goals in all competitions in the 2020/2021 season. In the Women’s Super League she has assisted 3 goals with 1273 minutes played so far. 

Key passing

In the graph below you can see the percentile ranks of Harder compared to the 27 players in my database. This shows in which percentile she is for every metric that belongs to the key passing side of the game.

As you can see in the graph, Harder is really good. She scores excellent in all the metrics against the players in his position who have played more than 900 minutes. She ranks above the 75th percentile in every key passing rank looked at and if we don’t look at the expected assists per 90, she even ranks 80th in every rank. Very impressive in this season so far.

This can also be seen in the beeswarmplot below. This visual shows us the same information, but the visual is slightly different as it visually shows us where the players are in terms of the metric and shows us how far ahead Harder actually is.

Through passes

As displayed in the title of this piece, this analysis is partly concentrated on the through passes of Harder. Until now I’ve analysed a lot of different passes, more specifically her key passing and goal. Now, I’m going to show her variety of through passes via 5 video examples.

In the video above we see Chelsea in their game against Manchester City. This shows two things in the through pass of Harder. She shows that she can play a through pass under pressure of the opposition and it shows that she can scan where the other attacking players are making their run, and she can play the ball behind the defence.

In the video above we see Chelsea in their game against Aston Villa. We see Harder on the left side getting the ball and at the same time she sees Kerr sprinting towards the penalty area. This particular shows that Harder has the technique and touch to gently nudge it past the defenders and to create a goalscoring opportunity for her team mates.

In the video above we see Chelsea against Everton. In this particular example Harder is playing in midfield at the moment she receives the ball, and moves forward. She spots her team mate running in behind and Harder pass the ball through the defence – with her left foot- to create another great goalscoring opportunity.

In the video above we see Chelsea in their game against Tottenham. Chelsea presses Tottenham as soon as the ball is with the opposition and Harder gets the ball just outside zone 14 and picks out Kerr again, this time swinging the ball into the six-yard box, to create another great scoring opportunity.

In the video above we see Chelsea play against Brighton and Hove Albion. In this particular case, Harder is pressing aggressively after which she regains possession of the ball and immediately sets up a dangerous attack by giving a through ball into the penalty.

Final thoughts

Pernille Harder has already proven in previous seasons to be an outstanding player, but in this season she is doing great things for the very successful Chelsea team and doing great overall in the WSL. She has adapted really well and it seems like she will only grow going forward.

LEWIS FIORINI: ANALYSING HIS ATTACKING QUALITIES

I might have upset a few people by not talking about this earlier, but this piece is fully committed to Lewis Fiorini. The young midfielder plays for NAC Breda at the moment and is on loan from Manchester City. NAC Breda is battling for the direct promotion places at the moment and the end of the season will be very interesting for the club, but as well for Lewis Fiorini. NAC Breda is a club with the potential to be a top-10 Eredivisie side, but since they play in the second tier, the pressure is immense and it’s a good learning ground for a loanees.

In this article I will focus on the data of Lewis Fiorini in the final phase of the attack. I will look at his passes and shots in the final third, and see how he contributes to the end product.

Profile

  • Nationality: Scottish/English
  • Age: 18
  • Date of birth: 17/05/2002
  • Current club: NAC Breda (L)
  • Career: Manchester City (Y), Manchester City U23
  • Position: Central midfielder
  • Secondary position: Attacking midfielder
  • Preferred foot: Right

Data analysis

Before I go into the actual data analysis and visualisations, I wanted to explain which data I’ve been using. All the data I’ve collected has gone through Wyscout and I have made a selection of all midfielders playing in the Keuken Kampioen Divisie/Eerste Divisie. The reason why I did this, is because of the fact that midfielders in this league tend to play on different positions with different roles. Therefore a player can play as a defensive midfielder one game, but play as a central midfielder the next – that’s why I made the decision to look at all midfielders.

I have been looking at players who have played more than 900 minutes in the 2020-2021 season and every player under this amount of minutes, will not be included. There are a few players that play for AZ Alkmaar, Ajax, FC Utrecht or PSV. These players are included, but some of them have also played games for the senior side and that’s important to take into consideration.

The analysis is made on the data available on the 2nd of April, unless noted differently – but in most data analysed here, the game against Go Ahead Eagles of last weekend has not been included.

Passing
I’m not looking at his actual numbers here per metric, but looking at the percentile ranks: how well does he perform in the key passing compared to other players in this specific league. Looking at averages of the league can tell me more than just looking at the outliers or comparing Fiorini to his teammates. There are 158 players in this dataset with at least 900 minutes including Fiorini.

If we look at the percentile ranks for key passing we can see some interesting things. He scores average for the following metrics: assists per 90, key passes per 90, passes to final third per 90 and through passes per 90. This can be explained by the fact that he often comes in the position to either shoot himself or provide the pass that leads to an assists. As you can see he scores quite high with the second assists per 90 and the passes to penalty area per 90.

A few things are below average as you can see in the graph above: progressive passes per 90, smart passes per 90 and expected assists per 90. These are metrics he might need to improve on, but that’s always depending on the position he assumes within the squad and the way the team plays. He is a central midfielder in a side that is competing for direct promotion to the Eredivisie and you would expect him to play high up the opponent’s half. He should have a higher expected assists per 90, but the progressive passes per 90 don’t really correspond with that story.

Above you see a video of the game of NAC Breda against FC Dordrecht. What immediately stands out is the fact that Fiorini gets the ball in the defensive third, moves into the middle third and spots Bilate – he provides a through ball to get Bilate in a 1v1 with the keeper.

There are two things that are done well by the player. The pass is of good quality and translates ball possession into a high-quality chance. The second thing is to play under pressure. Fiorini has three players of FC Dordrecht who are concerned with dispossessing him, but he can make the pass anyway.

In the above situation, the through pass become an assists for Bilate and NAC Breda manages to score a goal. This time from the break after a set-piece. He gets the ball and has space, and time to wait and give the pass to Bilate’s run. What he does wel is that he goes wide and exploit the fact that Almere City has the central zones covered – he then provides a through ball that is of such quality, that he can give Bilate an excellent opportunity to score a goal.

Assists

If we look at the total xA of Fiorini this season, this is an xA of 1,84 with a total number of assists of 2.

In the video above you see NAC Breda’s away game at Excelsior. It’s the second assists of Fiorini in this season so far, and although the we have talked about his through balls a lot, here we can see that he can deliver a cross into the box as well. Kaj de Rooij makes the most of it and scores after an excellent cross.

Shooting
His shot numbers are quite okay. He has shot 30 times in the Dutch Eredivisie of which 33,3% were on target. Of those 30 shots, goals were scored with an xG of 2,39. He has an average of 1,44 shots per game in the 2020-2021 season with NAC Breda. This includes the game against with Go Ahead Eagles of last weekend.

Goals

As you can see, Fiorini scored above average in the goals per 90, but scored a little below average in the xG per 90 for midfielders in the Eerste Divisie. In comparison with this expected assists and assist, he does better in this department. He has a total of 2,39 xG and has scored goals so far in the Eerste Divisie.

In the videos below you can see the 4 goals scored by Lewis Fiorini during the 2020-2021 season and they show a particular set of skills from the young player.

What we can see in the videos above is that Fiorini likes to get in the so-called zone 14 and shoot from there. Three of his four goals come from that type of situation. If he has space to move up in the final third and gets time in the central zones, he will go for the shot and try to score. He has a very decent right foot and all of his goals have been scored with that foot.

Final thoughts
It’s worth noting that Lewis Fiorini often gives the ball before the assist – the second assists – and he does very well in that metric, as we have seen above in the percentile ranks.

I would say that it’s an impressive season for the young player. He came into a club with big potential and that deserves to be in the Eredivisie when you look at their history. This means a lot of pressure from the club and fans. Fiorini has dealt with that well and translates his abilities onto the pitch. If we look at these attacking numbers, they definitely will need to go up in the future – to make a bigger impact on the pitch. But with his key passing on the pitch, he can show at times what an exciting talent he is and will definitely play in higher leagues in the future.

Data: Wyscout
Video: Wyscout
Telestration in video: Metrica Play

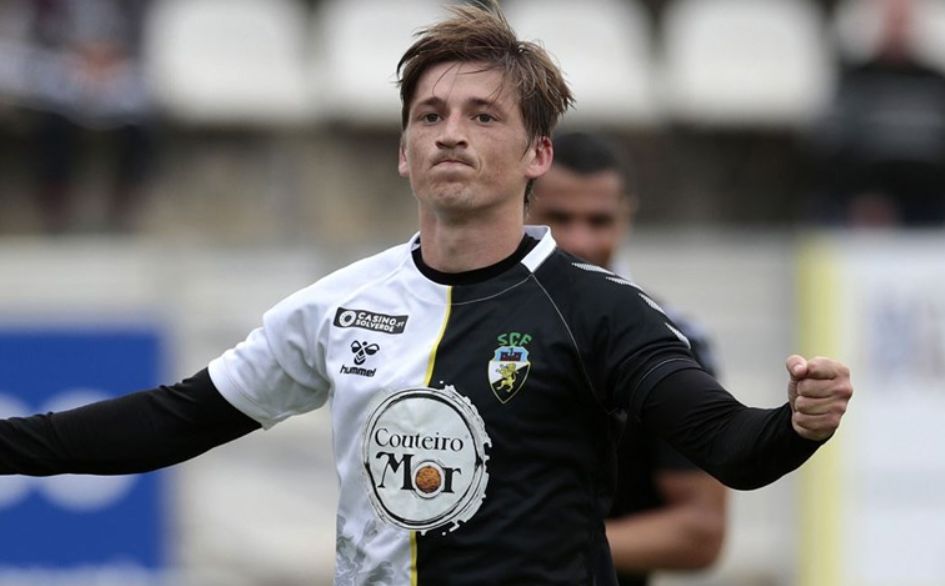
Ryan Gauld – Through pass analysis

Ryan Gauld is somewhat of a hype at the moment, and I’ve seen a few pieces on his performances – that’s why I haven’t written about him before. Although it’s not an excuse, I truly think that too many of the same pieces are not innovative and that’s why I didn’t want to write something trivial on this particular player.

In this article I will have a brief look at his passing in the last five games he played, especially his key passing. After that, I will look more closely to his through passes that he attempted in 2021 via a short video analysis of those passes.

The data is provided by Wyscout and the videos are also downloaded from Wyscout.

Pass clusters
In these pass clusters I will look what the most common clusters (4) were in the last four 90 minutes Ryan Gauld played. These game were against Benfica, Famalicao, Belenenses and Boavista.

Passcluster #1
Passcluster #2
Passcluster #3
Passcluster #4

Key passing statistics in 2020-2021
In the graphs below you can see a few comparisons (scatterplots) in the key passing metrics. In these graphs the 57 best midfielders – according to Wyscout – are included, illustrating how well Ryan Gauld is doing among his peers.

In the graph above you can see the scatterplot for the metrics Passes to final third per 90 and Passes to penalty area per 90. These metrics illustrate how often a pass is played to a specific area of attacking threat where the attackers might create a goalscoring opportunity. In the case of Ryan Gauld, you can see he does quite well in the passes to penalty area per 90 (3,29 passes to penalty area per 90). If we look at the passes to the final third per 90, he doesn’t do as well compared to the other midfielders: 2,86 passes to the final third per 90.

It’s hard to describe what effect a key pass or through pass has without looking at it – which we will do in the video analysis part of this piece – but the attempts to make a pass that contributes to the attack of your team, can be found in the metrics Key passes per 90 and Through passes per 90. We can see that Gauld attempts quite soms key passes per 90 compared to his peers: 0,39 key passes per 90. If we look at the Through passes per 90, he is quite average in passing: 0,78 through passes per 90.

If we look at the data from the key passing metric, surely we are interested to know in what passes lead to a goal or are expected to lead to a goal. We can assess that via the expected assists per 90 and the actual assists per 90, as illustrated in the scatterplot above. Gauld performs very well in this metric among midfielders. He has 0,2 xA per 90 and 0,16 assists per 90 â€“ which compared to midfielders in the Primeira Liga is quite good.

In the two grapsh below you can see how well he does compared to the other midfielders in terms or percentile ranks and in in a beeswarm plot.

Video analysis

I had a look at 5 different moments in 2021 where Ryan Gauld attempted a through ball in the Primeira Liga. In the first two videos you can see that he tries to pass the ball through the defence in order to set up the attackers, but he does follow through when the passes are not received. He follows the ball and presses the opponent.

In both occassions the ball doens’t reach the target, which is the attacker who moves forward to receive the through ball. At that particular moment the ball is lost, but the way Gauld presses – makes sure that the ball is recaptured or the opponent is forced to make a difficult decision, which means more chance to regain possession of the ball.

In the videos above we have seen him turn and give a through ball through the middle. Another option for Gauld is to receive the ball on the flank, wait for the movements of forwards and bring the ball into the assists zone, as can be seen in the video below.

Ryan Gauld is good in giving these kind of through passes from the final third into attacking positions, but he does well in transition from defence to attack as well. He can progress the ball from the defensive third to attacking third quite easily with a through ball that has length.

Final thoughts
Ryan Gauld has gotten invaluable experience in Portugal and is having quite the season. His attacking contribution via key passing has definitely sparked interest from scouts and recruitment analysts in Portugal and Scotland, but also in the rest of Europe. Performing in this kind of league with these decisive passes is a hard thing to do. I appreciate this is only a small element of his game, but there’s no doubt interesting stuff to be said about the player.

Data: Wyscout
Video: Wyscout
Telestration in video: Metrica Play

Mees Hoedemakers – 1st Scout report

Perhaps you know a lot about the Keuken Kampioen Divisioe or Dutch Eerste Divisie (2nd tier). Perhaps you don’t. What’s evident is that a few teams are dominating the league and will be up for possible promotion to the Eredivisie. Traditionally, this league has set up great Eredivisie-talent and groomed players for a higher level.

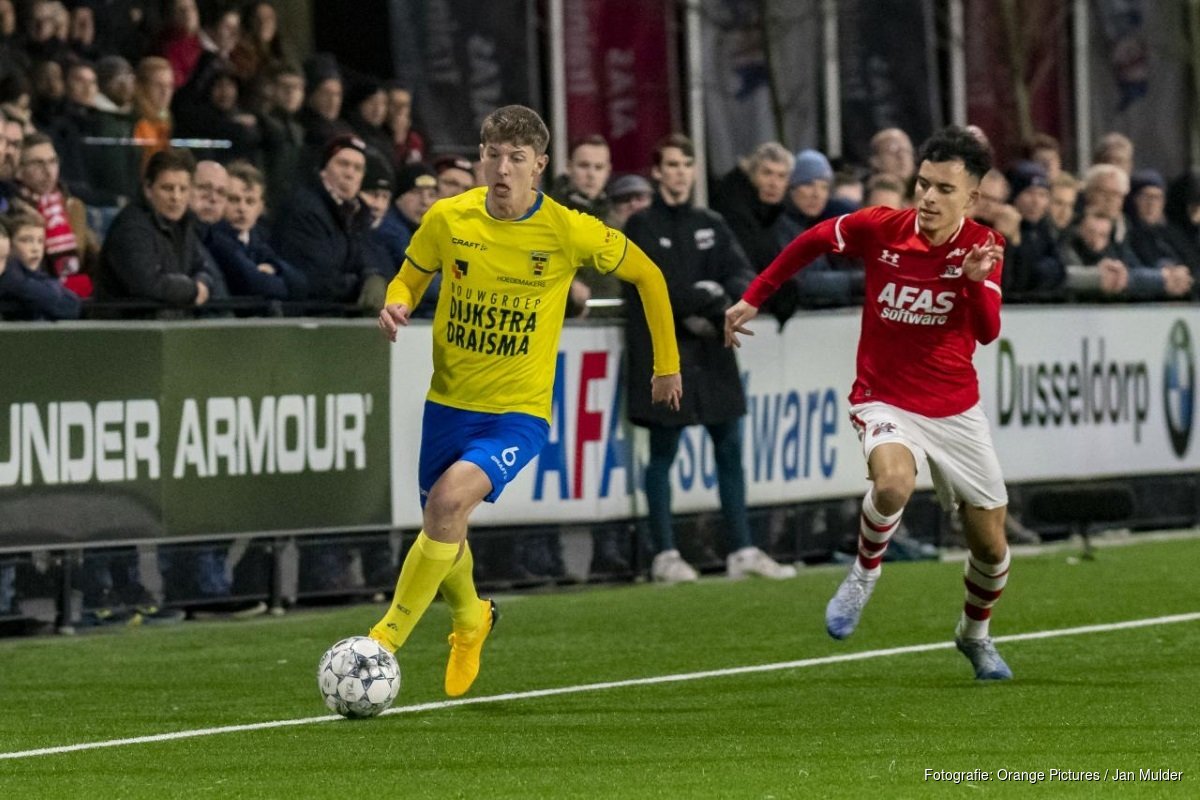
In this scouting report I will look at SC Cambuur’s Mees Hoedemaker, who plays the majority of his games as a defensive midfielder in a team that tops the league at the moment.

Background

  • Nationality: Dutch
  • Age: 23
  • Date of birth: 18/02/1998
  • Current club: SC Cambuur
  • Career: AZ Alkmaar (Y), AZ Alkmaar, SC Cambuur (L), AZ Alkmaar, SC Cambuur
  • Position: Defensive midfielder
  • Secondary position: Central midfielder
  • Preferred foot: Right and left
  • Contract until: 30/06/2022

General

SC Cambuur often plays in two different formations. Either the 4-3-3 formation with a deep-lying midfielder/defensive midfielder or a 4-1-4-1 formation. In those formations with a single defensive midfielder, Hoedemakers played there.

His task in possession was to hold the line high and give first coverage to the attacking midfielders in terms of transitioning to another phase of play, and to distribute passes to the more attacking players.

Hoedemakers plays as the defensive midfielder in three-man defence and played between the defence and the midfield.

His task out of possession was to drop down in order to assists the four-man defence and play just in front of it. The compact 4-1 defensive bloc would then effectively become a 5-man defence. In the defensive phase of the game, he would join the four-man defence – which effectively made it a 5-3-2 formation. He’s intelligent and stands 1.82 metres tall, able to defend in the air well. As soon as the opponent’s got the ball, he either pressed the ball or he man-marked his direct opponent.

He’s enthusiastic, but this also means that he makes fouls in trying to recover the ball. His positioning is good, but his awareness can be better. He often opted to give a long pass, when others were available close to him. He’s confident in his technical abilities and shows this when they attack.

Defensive stats

In this data analysis I will look at the complete set of midfielders in the league. Why? Because the positions are not set in stone in this league and as a result, the players are fluid in their positions. Defensive midfielders will also play as central midfielders, central midfielders as attacking midfielders – you get the jist. I’ve selected a total of 83 midfielders across the league and I’ve barred one player, as he regularly plays for FC Utrecht in the Eredivisie, but has had a few minutes with the U23 team as he was recovering from an injury.

First, we will look at some defensive stats of Mees Hoedemakers. In the image below you can see the position adjusted stats for Interceptions per 90 and Sliding tackles per 90. In other words, how much does a certain player defensively engage an opponent in 90 minutes.

You can see that Hoedemakers has slightly aboe average when you look at the interceptions per 90, which means he does well in engaging in intercepting passes. In sliding tackles he doesn’t perform above average and you can read that in two different ways: he doesn’t like to tackle OR he doesn’t get himself in situation where he has to make a last minute attempt to recover the ball.

In his possession winning defensive duels is vital. He needs to cover for his attacking midfielders, but at the same time form the first line of defence before the back-four has to become involved. In the image above you can see that he ranks very high in the percentage of duels won:, and the amount of defensive duels he has per 90 minutes played.

Passing stats

The next data I will look at, is the passing data. How well does Hoedemakers do in this data compared to other defensive midfielders in the league. The reason why I opted for a comparison with defensive midfielders and not all midfielders, is that the defensive midfielders will not always choose to play a ball forwards more than an attacking midfielders would.

In the image below you can see the percentile ranks of Mees Hoedemakers compared to the 30 best defensive midfielders next to him.

He scores very high in the key passing metrics, as you can see above. Progressive passes is something he could work on – but everything apart from that is way above average and it’s no wonder that he is considered a player that needs to play in the Eredivisie or higher next season.

Defensive positioning

What I think is really good about his play is his defensive positioning. What I mean by this is how he reacts and moves when the ball is lost by SC Cambuur, and the transition phase from attack to defence sets in. To look into this further I’ve looked at a few situations in the game against Top Oss from February 16th.

In this situation he joins the attacking midfielders in passing forwards, but in the transition he has to trail back to assist his defence, which he does by positioning himself decent against his direct opponent and making sure there are no space unoccupied in the middle third of the pitch.

In the second half there was a similar situation: the ball was lost high in the middle third and Hoedemakers was up there as well. In order to neutralise the danger by Top Oss he had to do two things: trail back to the defensive third, just in front of the defence, and make sure that the attacking players of Top Oss wouldn’t be able to progress through the middle.

Conclusion
It’s worth to look at Mees Hoedemakers as a defensive midfielder with a good key passing quality. SC Cambuur are comfortably the best team in the league, but Hoedemakers impressed last season already and has continued his form. His mental strength has improved in the last season as he isn’t as ill-tempered as before and can deal with disappointments better. He is definitely fit for the Eredivisie or perhaps for a league in another country.

I will scout him further in a series of games to assess his full capability, but he has impressed me a lot.

Data and video from Wyscout
Telestration made with Keyframe Sports

Data scouting: on the hunt for a complete central midfielder in German 2. Bundesliga

It’s time for a data piece again isn’t it? I haven’t written anything on my blog about data and scouting since the beginning of January and it’s time for a new venture. In this article I wanted to look at one specific league and look for a central midfielder. Why a central midfielder? Because I think it’s hard to assess whether a midfielder is a central midfielder in comparison to a defensive/attacking midfielder. I have chosen for the 2. Bundesliga, because it’s a league well-respected, but also a little bit all over the place. It hasn’t been scouted by myself as much as the Championship, Ligue 2 and Serie B – so that’s why I chose this league.

The data I’m using for this analysis is provided by Wyscout and in their database I’ve been looking for the best midfielders in each metric – which I will mention below. I’m looking at a data set of 30 midfielders as we are looking specifically for the best central midfielders and not the best midfielder with central midfielder qualities.

In this article I will look at the following metrics:

  • Goals & assists
  • Passing
  • Dribbling
  • Defensive duels
  • Interceptions and sliding tackles

The 30 best players I’ve found on Wyscout are as follows:

When looking at this data, I wanted to have a player to have 900 minutes or more on the pitch (=10 full games in total) and that’s why I excluded Hunt and Kinsombi in my further scouting. The total of players I will look closer at is 28.

Goals and assists

First I will look at the attacking numbers as central midfielders are often involved with goalscoring or creating the goalscoring opportunities. In the image above you can see the expected assists vs the acutal assists in this 2020-2021 season in the 2. Bundesliga. A few players really stand out in this metric: Sessa, Justvan and Kempe. Kempe has a high xA and is right on level with the assists according to that xA. Justvan and Sessa are overperforming, as their assists per 90 are higher than the quality of the passes would suggest.

In the image below I had a look at the goals of these central midfielders.

If we look at the expected goals per 90 and the goals per 90, there are three players really standing out. Muhling with 0,3 xG and 0,37 goals per 90, Green with 0,35 xG and 0,39 goals per 90, and Kempe with 0,31 xG and 0,42 goals per 90. These three really stand out and all are slightly overperforming their xG: converting those chances into goals more than the chances would suggest.

Passing

A midfielder is tasked with a lot of passing. Obviously they are tasked with progressing attacks, but they are also connecting the defence with the attack and have a vital role going forward. In this first visual on passing, I will look at the progressive passes vs progressive runs, to see how well they progress on the pitch.

Four midfielders really stand out with their progressive passing during this season. Becker has 7,3 progressive passes per 90, Riese also has 7,3 progressive passes per 90, Seguin has 8,5 progressive passes per 90, and Sontheimer has 9,4 progressive passes per 90.

As said above, the central midfielders also have a vital role going forward with their passing. In the image below you can see the key passes per 90 vs the through passes per 90.

If we look at the key passes per 90, four players stand out: Jae-Sung Lee with 0,51 key passes, Seguin with 0,53 key passes, Hauptmann with 0,54 key passes, and Zalazar with 0,66 key passes. When we look at the through passes per 90, three players stand out: Becker with 1,33 through passes, Seguin with 1,42 through passes, and Mehlem with 1,89 through passes. Overall, Seguin scores the best in these metrics.

Dribbling

How well do they perform with the ball and maintaining control of the ball? We can look at this with the metric of dribbles. It’s not always possible to pass the ball or sometimes there’s space going forward, so dribbling can be a very important part of a central midfielder’s play.

The best dribblers in this season of the 2. Bundesliga so far are Becker with 3,32 dribbles and 78%, Sessa with 4,09 dribbles and 63,64%, and Justvan with 4,65 with 68%.

Defensive duels

It obviously is not only attack, attack and attack. Defensive positioning and duels are very important. In this metric we will see how well they do in the defensive duels as they assist the defensive midfield in order to strengthen the defensive block.

Kroos (63,11%), Sobottka (63,54%), Becker (64,15%), Fandrich (64,81%) and Morales (65,12%) have the highest percentage of won duels in this season in the 2. Bundesliga, but I’m particularly impressed with Krauss, as he has over 9 defensive duels per 90 with a win percentage of 62,42.

Sliding tackles and interceptions

Part of the defensive actions in a game are the sliding tackles and interceptions. What do they say? Interceptions say something about seeing the problems/opportunities in front of you, while sliding tackles say something about the ultimate defensive action. Obviously it’s different for teams with a lot of possession and teams without possession, that’s why it is adjusted for possession.

What immediately stands out is that Gnjatic has a lot of interceptions and sliding tackles. This means that he is involved in a lot of defensive actions in his games and stands out from the rest with 1,94 sliding tackles per 90 and 7,77 interceptions per 90. I think that Krauss does very well in his forward thinking with 8,38 interceptions per 90.

Short list:

All things considered I’ve made a short list of players who are complete central midfielders according to the data we’ve looked at:

  • Kempe – Darmstadt 98
  • Krauss – Nürnberg
  • Seguin – Greuter Fürth
  • Sessa – Heidenheim
  • Becker – St. Pauli.

The next step is to look at these 5 players in different games and follow them via video scouting.

Data from Wyscout
Tableau Public:

https://public.tableau.com/profile/marc.lamberts#!/vizhome/CentralmidfieldersGerman2_bundesliga/