

Data without context is absolutely useless. Data in isolation is also useless. It might sound strange to hear these words from someone who predominantly works with data in football and focuses on metric and methodology development, but these are words I live by. Without knowing the (sub)context or watching games, it has a detrimental effect on the representation of data. Now, you might be wondering why I’m telling you this, but it has all got to do with how I approach a new metric.
In this article, I will explain a new metric I’ve developed using existing metrics: Conservative Pass Index. My articles usually focus on the methodology and mathematics behind it, but in this instance I want to grasp the semantics of it as well. We have “progressive” passes and I want to look at passes that are risk-averse or “conservative”. For me, passes that are not forward or progressive and focus on possession rather than breaking/progressing play.
Contents
- Why this metric?
- Data collection
- Methodology
- Analysis
- Final thoughts
Why this metric?
An unanswered question in most articles: why the hell should we use this new metric? Why is it developed? For me, it’s about defensive-minded data. The emphasis on metrics and metric development is on the aspect of creating attacking opportunities (and solely on-ball metrics, but that’s a discussion for another time) and therefore our understanding of data is heavily based on attack.
The balance between attacking and defensive metrics is off, but I want to have a metric that shows me how involved players are not in progressing the ball up the pitch, but in fact how conservative thy are in their passing. In others words, how much do they emphasise holding the ball in their own team’s possession? And, that’s how this metric came to be.
Data collection
The data I’m going to use for this specific research is match data from Wyscout. This was collected from the 2024–2025 season and focuses on the German Bundesliga. I will also put filters for minutes played (500 minutes played) and position — I want to look at central defenders, wing backs and full backs. The data was collected on Saturday, 14th of December, 2024.
The data used will be made into a new metric, which I will explain underneath.
Methodology
So how am I going to make this score? I will do this in Python, but there are 3 steps I need to take:
- Drop all the information I don’t need. I will keep the player name, team name, minutes played, and the metrics I use.
- The metrics I’m using are: Back passes per 90, Lateral passes per 90 and Short / medium passes per 90. All are per 90 minutes and not totals.
- I will weigh the different metrics for how much they contribute to progression: Back passes per 90 (3), Lateral passes per 90 (2), and Short / medium passes per 90 (1). The key aspect is here that conservative passesis more valuable to me when it comes closer to the own goal.
- I will calculate them into z-scores, which will make it easier to create a weighted total score.
To create a score that goes from 0–1 or 0–100, I have to make sure all the variables are of the same type of value. In this, I was looking for ways to do that and figured mathematical deviation would be best. Often we we think about percentile ranks, but this isn’t the best in terms of what we are looking for because we don’t want outliers to have a big effect on total numbers.
I’ve taken z-scores because I think seeing how a player is compared to the mean instead of the average will help us better in processing the quality of said player and it gives a good tool to get every data metric in the right numerical outlet to calculate our score later on.
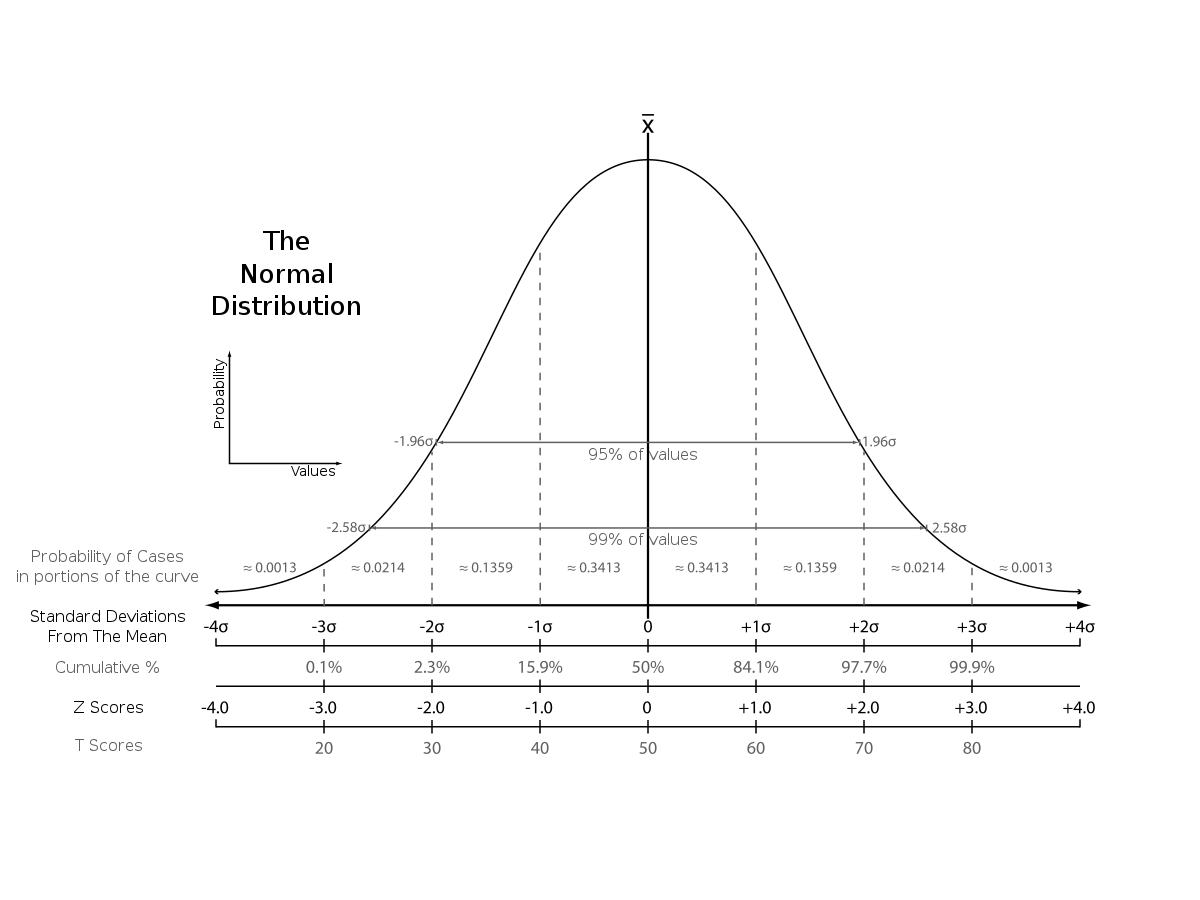
Z-scores vs other scores. Source: Wikipedia
We are looking for the mean, which is 0 and the deviations to the negative are players that score under the mean and the deviations are players that score above the mean. The latter are the players we are going to focus on in terms of wanting to see the quality. By calculating the z-scores for every metric, we have a solid ground to calculate our score via means.
We talk about harmonic, arithmetic, and geometric means when looking to create a score, but what are they?
The difference between Arithmetic mean, Geometric mean and the Harmonic Mean
As Ben describes, harmonic and arithmetic means are a good way of calculating an average mean for the metrics I’m using, but in my case, I want to look at something slightly different. The reason for that is that I want to weigh my metrics, as I think some are more important than others for the danger of the delivery.
So there are two different options for me. I either use filters and choose the harmonic mean as that’s the best way to do it, or I need to alter my complete calculation to find the mean. I am doing the harmonic mean.
Analysis
By running the code and calculation in Python — I will get a list. Now, that’s just a very boring-looking list, so I’m turning it into a visualisation. In the image below you can see the 10 best conservative pass score (CPI) players with at least 500 minutes in defence
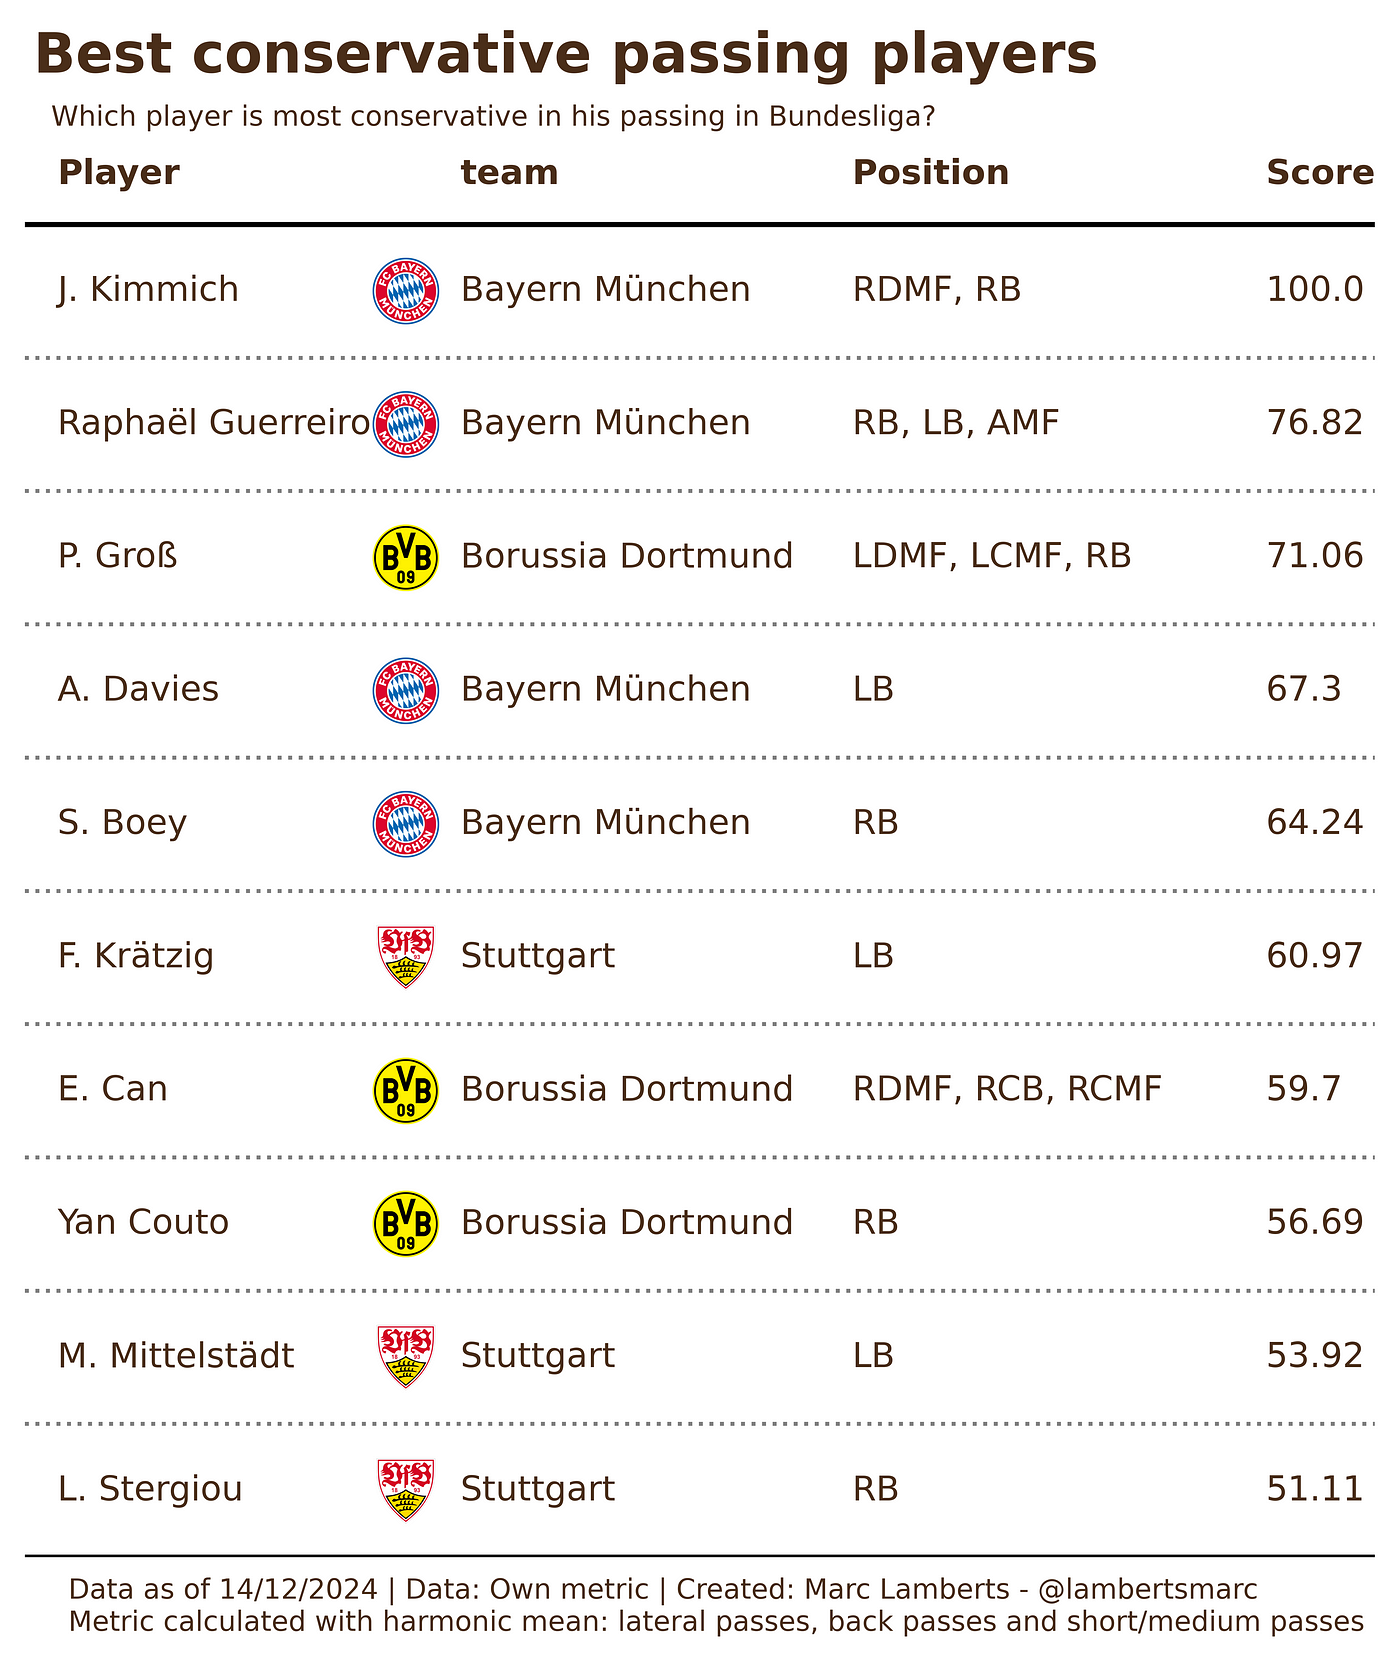
If we run the code and see the results we see these players who are most conservative in their passing. At first it might make sense, but there is a challenge here. I see three teams featured in here and if we look at the current table of most passes we see this:
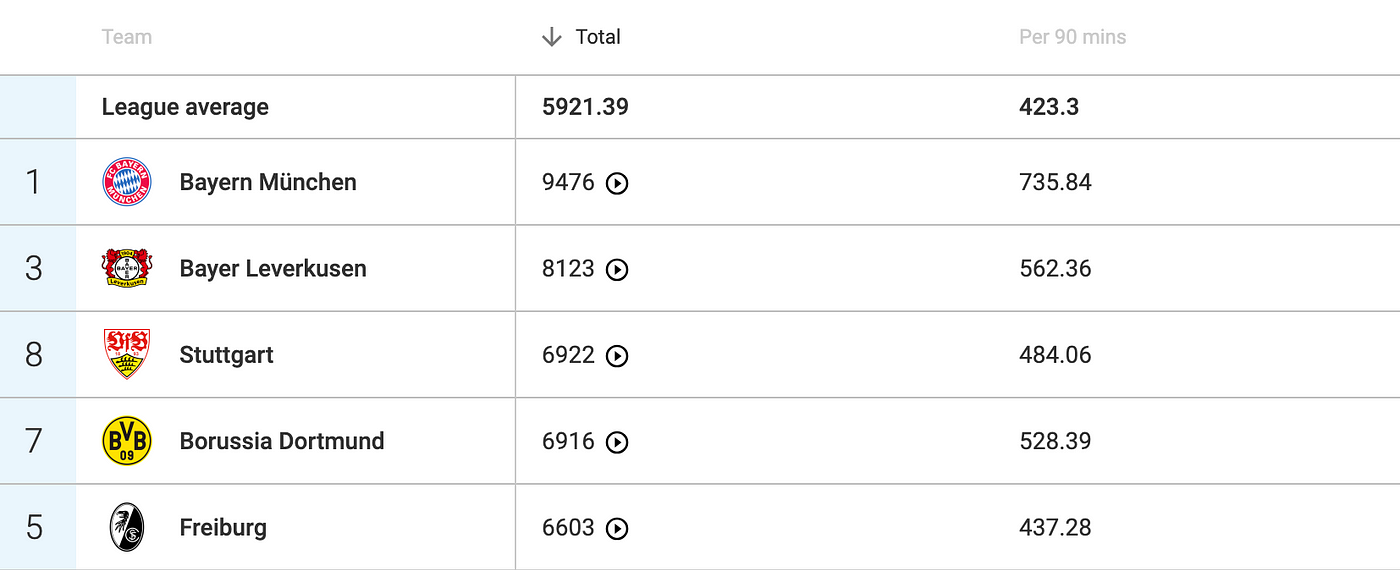
In terms of most passes played they are also featured in the top-4, which means logically they will have more share of the passes — even if they are conservative. We need to get back to the drawing board and change the volume of passes to that of % of successs, to create something with more quality.
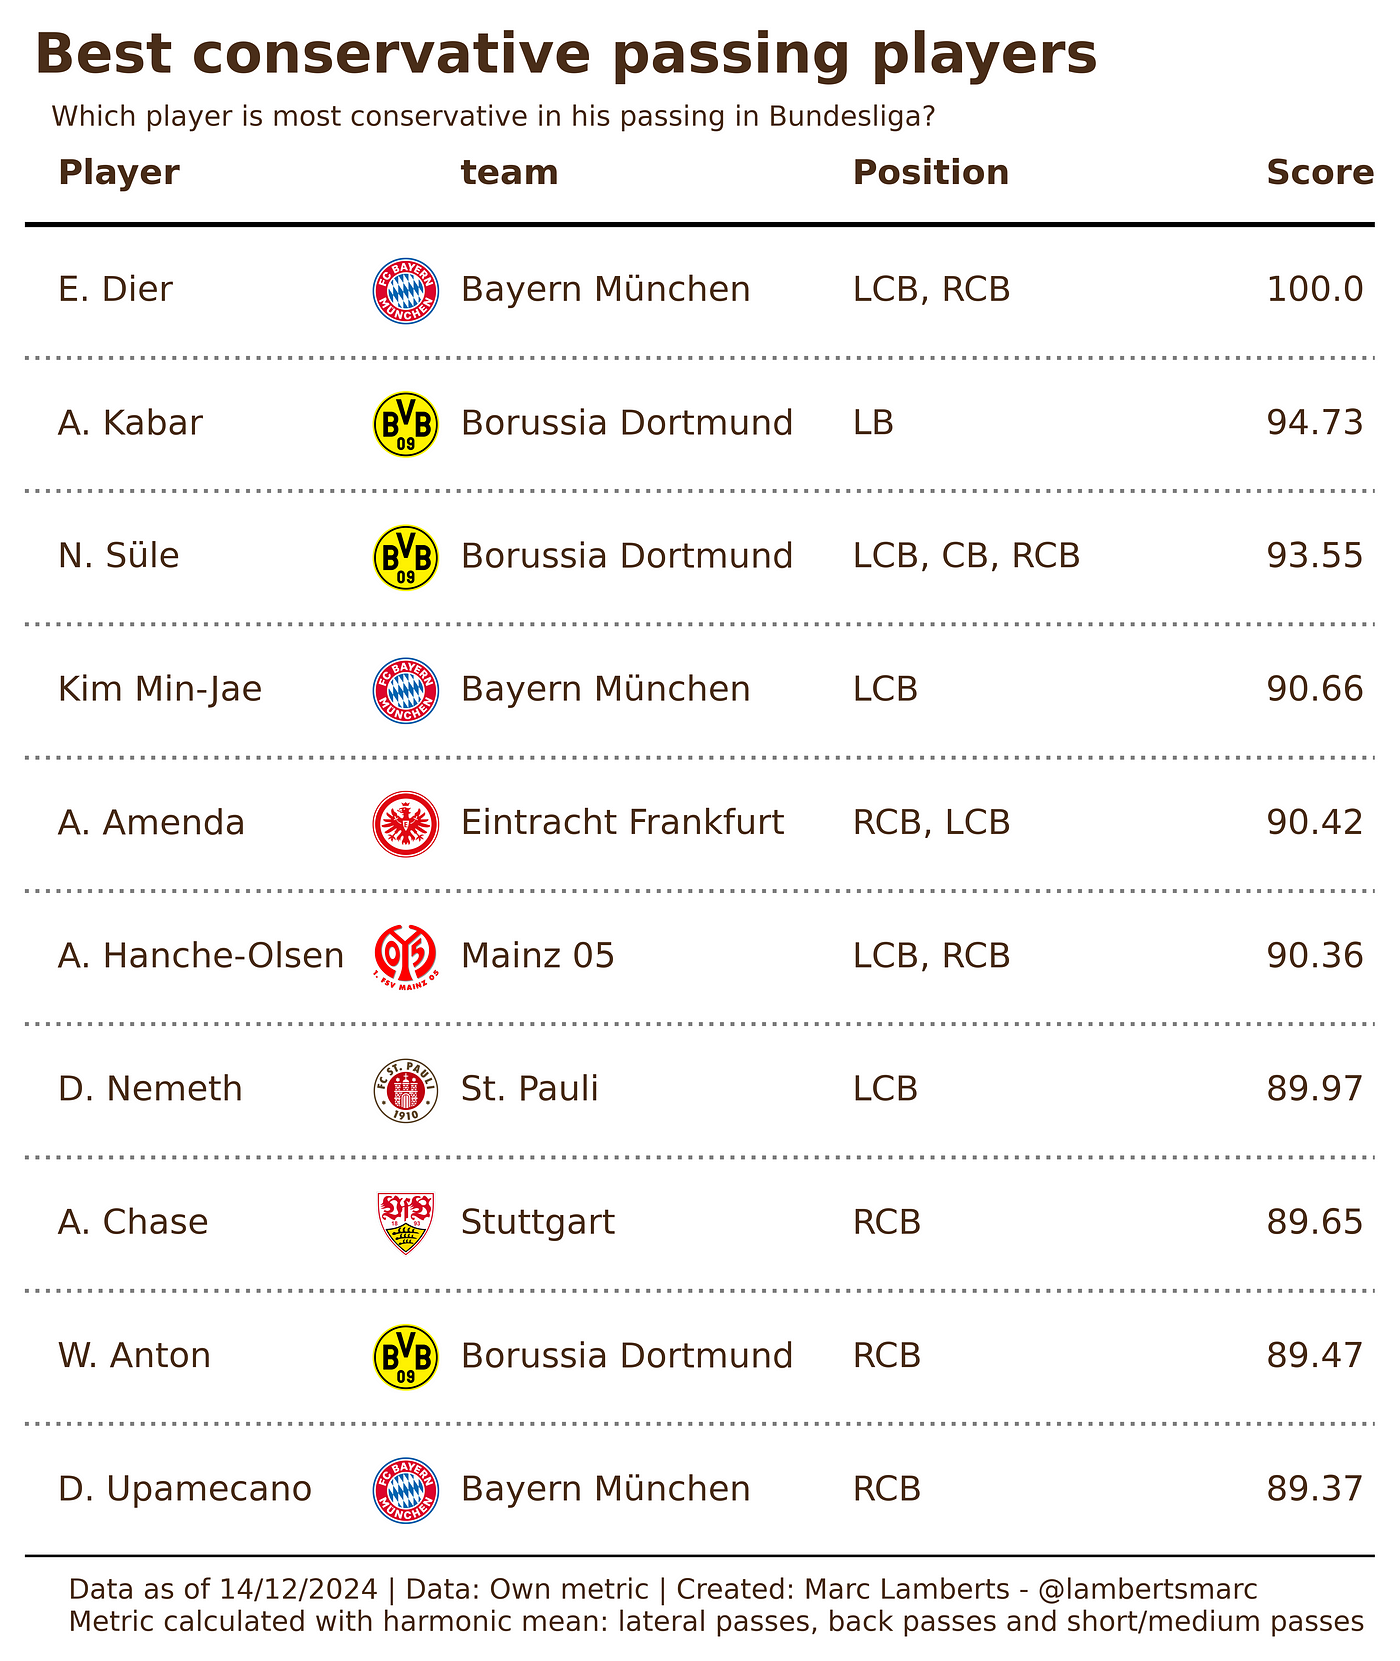
This looks slightly better if we cross-reference it with the eye test. More clubs are featured, and logically — central defenders should be more risk-averse and that’s the case here. Bayern München and Borussia Dortmund’s central defenders are most conservative in their passing.
Final thoughts
I like to play around with metrics and see how they can aid myself in the process of recruitment, especially in the phase where I use data quite heavily.
Conservative passing can be measured in different ways and that’s also why I think there is still work to be done on this metric. If you connect OBV, xT or xPass to these metrics — we can delve even further. Negative values can lead to more conservative thinking. Something to think about for the next update.