
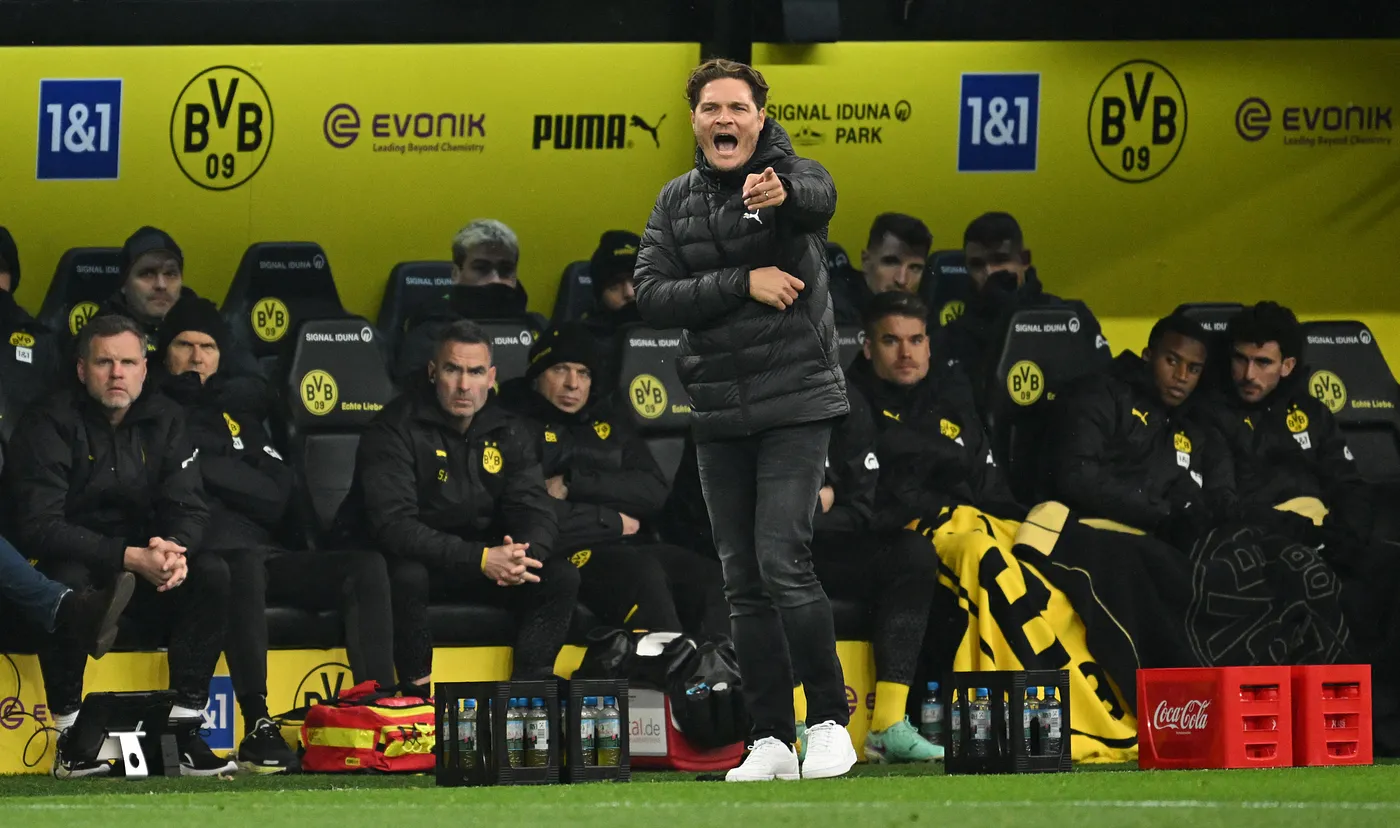
The German Bundesliga is the highest tier in German football and while the most excitement can be found one tier below, the Bundesliga does have some fantastic narratives and stories. One of those narratives is that Borussia Dortmund should be the main contender for Bayern München, but with Terzic as head coach, there are so many things going very well and very wrong.
read moreCategorie: Data analysis
DATA SCOUTING BELGIAN CHALLENGER PRO LEAGUE: FINDING A CENTRAL DEFENDER
Who are the best defenders in the Belgian second tier, the Challenger Pro League? In this scouting piece I’m going to look for a central defender with an accent for ball progressing capabilities. There are different types of central defenders, but I’m looking for a profile that fits a central defender who can carry the ball and thinks progressively.
The data
The data used in this analysis comes from Wyscout. In the dataset for the central defenders, I’ve selected each player who primarily plays on the central defender position. Obviously, there are other players who have played in this position, but I’ve only selected the players that have played as a central defender as a dominant position in the current season. This leaves me with 68 players who qualify in the Challenger Pro League 2022-2023
Because I’m looking at the current season, I want to make a selection for players that played a decent amount of games for me to assess them. For me, it’s important that they played at least 450 minutes in this season. After looking at that I’m left with 46 players in my dataset and they will go through my analysis process. The data was retrieved on 5th January 2023.
I will look at the following categories and metrics to assess their abilities through data:
- Defensive abilities:
- Ball-carrying abilities
- Passing abilities
After going through the data analysis and visualisation, I will make a shortlist of players who I think are worth keeping your eye on.
Defensive abilities

The importance of defensive duels is evident. It’s to measure the physicality of a central defender and the ability to win defensive duels to assess how well a player defends in defensive situations.
The most defensive duels conducted per 90 are by the following players: Heris with 9,31 defensive duels per 90, Konstantopoulos with 11,25 defensive duels per 90 and Engwanda with 11,33 defensive duels per 90.
If we look closer at the players that have the highest percentage of won defensive duels, the following players stand out: Wuytens with 77,08% defensive duels won, O’Brien with 78,08% defensive duels won and Mawete Kinsiona with 78,21% defensive duels won.

The importance of aerial duels is to assess two things. Firstly, to look how many times a certain player conducts in an aerial duel during 90 minutes of football. And secondly, to assess how many of those aerial duels are won per 90. The aerial capability can be a contributing factor in the defensive strength of a central defender.
The most aerial duels conducted per 90 are by the following players: Lemoine with 5,5 aerial duels per 90, Konstantopoulos with 5,89 aerial duels per 90, and Vukotic with 6,02 aerial duels per 90.
If we look closer at the players that have the highest percentage of won aerial duels, the following players stand out: Bateau with 75% aerial duels won, O’Brien with 76,54% aerial duels won, and Vukotic with 78,13% aerial duels won.

In the scatterplot above we can see the metrics PAdj sliding tackles per 90 and the PAdjinterceptions per 90. These metrics help us assess the defending quality of a central defender, because it shows a form of intelligence of a player. You have to recognise the movements of the opposition to adequately make a defensive actions, and therefore these metrics are useful.
Most PAdj tackles per 90 are by the following players: Vukotic with 1,39 tackles per 90, Khemais with 1,95 shots blocked per 90, and Konstantopoulos with 2,31 shots blocked per 90.
If we look closer at the players that have the most Interceptions per 90, the following players stand out: Le Joncour with 9,75 interceptions per 90, Didden with 9,86 interceptions per 90, and Vukotic with 10,09 interceptions per 90.
Ball-carying abilities

Ball-carrying is a valuable thing for a player to have. The ability to literally carry the ball from the defensive third to the middle or attacking third is not to be underestimated, and this is no different for central defenders that I’m scouting. I’m well aware that this is not something every central defender can do, but I’m looking for a progressing central defender in possession. In what manner do they conduct themselves in progressing the ball? This can be translated via data with the metrics dribbles per 90 and progressive runs per 90.
If we look at the progressive runs per 90 metrics, we can see that three players really stand out from the crowd here. Hautekiet has 1,87 progressive runs per 90, Meisl has 1,89 progressive runs per 90 and Terekhov has 2,13 progressive runs per 90.
When we look at the dribbles per 90, we see slightly different players. The top players in this metric are: Heris has 2,03 dribbles per 90, Sabbe has 2,12 dribbles per 90, and Mawete Kinsiona has 3,12 dribbles per 90.
Passing ability

Passing abilities. I could focus on the percentage of successful passes, but that doesn’t say a lot in itself. I want to see how well they progress the ball as well as without the ball. I’ve looked to the progression with the ball on their feet, but I also want to see how well the progression in passing is. That’s why I chose to look at progressive passes per 90 and passes to the final third.
Looking at the progressive passes we see a few players stand out: Matthys with 13,29 progressive passes per 90, Butera with 14,44 progressive passes per 90, and Van den Bergh with 15,58 progressive passes per 90.
If we look closer to the passes to the final third, we see some of the same names featured at the top. Matthys has 8,84 passes to final third per 90, Hubert has 9,11 passes to final third per 90, and Van den Bergh has 12,09 passes to final third per 90.
Final thoughts
With this data analysis of players we have seen which players do the best in the central defender role in the Belgian second tier with at least 450 minutes played in this season. From this analysis we will make a short list and from that short list, we move on to video scouting and live scouting.
PPDA SHOULDN’T BE USED TO MEASURE THE PRESSING INTENSITY
Okay, maybe that title is too strong. I’m not sure. But I know that using a single data metric to value an off-ball action is incredibly vague and complex. Especially when we look at data, it’s so difficult to quantify pressing activities. So, in this article, I will tell you why I think PPDA isn’t the right metric AND should never be used alone to measure pressing intensity.
Pressing
Pressing is an important tactical aspect of football that involves one team actively trying to win the ball back from the other team. Pressing can take many different forms, from a high press in which the team presses aggressively and high up the field, to a low block in which the team sits deep and focuses on defending their own goal.
One of the main benefits of pressing is that it can disrupt the opposition’s attacking play and prevent them from building up momentum. By winning the ball back quickly and high up the field, a team can catch the opposition off guard and potentially create scoring opportunities for themselves. Pressing can also be effective at tiring out the opposition, as it requires a lot of physical and mental effort to constantly try and play through a press.
Pressing can also be an effective way to defend against teams that are strong in possession. By forcing the opposition to play quickly and under pressure, a team can reduce the time and space that the opposition has on the ball, making it more difficult for them to create scoring chances.
However, pressing is not without its risks. If a team presses too aggressively and leaves gaps in their defense, they may be vulnerable to counter-attacks. Additionally, if a team is not well-organized or does not have the physical fitness to maintain a press for an extended period of time, they may struggle to win the ball back and may be more susceptible to conceding goals.
Overall, pressing can be a valuable tactical tool in football, but it is important for teams to carefully consider the context of the game and the strengths and weaknesses of their opponents before deciding whether or not to press.
Data context
Context is important when working with data because it helps to provide meaning and interpretation to the data. Without context, data can be difficult to understand and may not provide a clear picture of what is happening.
Context is also important when comparing data from different sources or time periods. Without context, it may be difficult to accurately compare data because we don’t know if the data was collected in the same way or if it is relevant to the same issues.
In summary, context is important when working with data because it helps to provide meaning and interpretation to the data and allows us to accurately compare and analyse it. Without context, data can be difficult to understand and may not provide a clear picture of what is happening.
PPDA
PPDA (passes per defensive action) is a metric that is used to measure how aggressively a team presses or defends. It is calculated by dividing the number of passes that a team allows by the number of defensive actions (tackles, interceptions, etc.) that they make.
While PPDA can be a useful metric for measuring pressing, it is not sufficient on its own for several reasons:
- It only measures the number of passes allowed, not the quality of those passes. A team could allow a high number of passes but still, be effective at pressing if they are able to force their opponents into making low-quality passes. The quality of the passes allowed is important because it can impact the success of the press. For example, if a team allows a high number of passes but those passes are all long balls that are easily cleared by the defense, then the press may still be effective even though a high number of passes were allowed. On the other hand, if a team allows a low number of passes but those passes are all short, accurate passes that allow the opposition to easily bypass the press, then the press may be less effective.
- It does not take into account other factors that can impact pressing, such as the positioning of players, the speed of the press, and the overall tactics of the team. The positioning of players is important because it can affect the effectiveness of the press. For example, if a team has their defenders positioned too high up the field, they may leave gaps in their defense that the opposition can exploit. Similarly, if a team’s midfielders are positioned too far apart, they may struggle to effectively press the opposition and may be unable to win the ball back. The speed of the press can also be important. If a team presses too slowly, they may allow the opposition time to bypass the press and launch an attack. On the other hand, if a team presses too quickly, they may leave themselves vulnerable to counter-attacks if they are unable to win the ball back. The overall tactics of the team can also impact the effectiveness of the press. For example, if a team is using a high press, they may be more effective at winning the ball back in the opponent’s half of the field. However, if they are using a low block, they may be more focused on defending their own goal and may be less effective at pressing.
- It does not account for the opposition’s attacking quality. A team may allow a low number of passes but still be ineffective at pressing if they are facing a strong attacking team that is able to break through their press. The attacking quality of the opposition can impact the effectiveness of the press because it determines how difficult it is for the pressing team to win the ball back. If a team is facing a strong attacking team with skilled dribblers, creative passers, and clinical finishers, they may struggle to effectively press and may be more likely to allow passes. On the other hand, if a team is facing a weaker attacking team, they may be more successful at pressing and may be able to win the ball back more often.
- It does not take into account the context of the game. The score, the time remaining, and the overall strategy of the team can all impact how aggressively they press. For example, if a team is trailing late in the game, they may press more aggressively in an attempt to try and equalize. On the other hand, if a team is leading and is looking to close out the game, they may be more conservative and focus on defending rather than pressing. The overall strategy of the team can also impact their pressing tactics.
Final thoughts
PPDA is a data metric which can assist in measuring pressing in a game, but in isolation it doesn’t mean a lot. This is strengthened by the notion that off ball actions aren’t properly caught in data collection yet.
SET PIECE ANALYSIS: EXPECTED GOALS ON TARGET (XGOT) IN EREDIVISIE 21/22
Whilst we are already a few rounds into the Eredivisie 22/23 season, it’s still very interesting to have a look at the 21/22 season. I’m particularly fond of set piece, attacking corners in particular, and how teams try to generate chances from them. In this analysis I will try to do exactly so.
In this analysis, I will attempt to have a look at the shot locations of each team playing in the 21/22 season with data from Opta and look at the zones that give the great threat and/or chances for the attacking side. These will be done via data visualisations with expected goals on target.
The distinction is made between expected goals and expected goals on target (xGOT). This has been done to an idea of which players do have an impact of scoring and actually forcing the goalkeepers to a save or defensive action.
CONTENTS
- Theoretical frame: data
- Theoretical frame: methodology and tools
- Most impactful teams
- Teams: Expected goals on target per zone
- Teams: successful routines per most successful zone
- Final thoughts
THEORETICAL FRAME: DATA
For this analysis, data will be used and there are two types of data that are being used.
The first type of data is so-called match data which focuses on different data metrics that are quantitative. They focus on how many times a certain player makes a certain action that’s translated to a data metric. This will be used for the number of corners taken, the shots generated from them, and the goals. This data has been collected via Wyscout’s data and was collected on Saturday 20th of August, 2022.
The second type of data is event data. This type of data focuses on X and Y locations on the field and records an event. We can collect many data events with this type of data, but in this analysis, we only look at the shot locations and the corresponding values assigned to them. We will then look at the expected goals on target that go along with the shot locations. This filters the shots that are blocked and go wide, to suit the impact analysis we are doing. This data has been collected via Opta’s event data and was collected on Monday 15th of August, 2022.
THEORETICAL FRAME: METHODOLOGY AND TOOLS
With the data we have collected, we have all shots conducted throughout the season in the Eredivisie 21/22. There are two different tools I will use to do the research for our analysis — because we focus on the attacking corners of each side.
The first tool we use is Tableau and we use this for the quantitative data collected via Wyscout. With this, we can make scatterplots and bar graphs quite easily, and give an overview of how well each team is doing. This can be considered as data that lies on the surface and quickly gives us an idea of how the strengths are lined up. We view everything in metrics per 90 minutes, as that gives a better idea of the average performance in set pieces per each team.
For the shot locations, I use a different tool. The data was collected via Python and in Python, I will use this data to do data analysis and to make the visualisations. These visualisations are inspired by Son of Corner and he has an excellent tutorial here, how to make these visualisations.
After loading all the data in my code, I make sure to filter for a few things. Firstly I filter a team, then I filter only expected goals on target and I make sure the data only looks at shots as a consequence of a corner. After I have done this, I can start with making the visualisations and the data analysis.
MOST IMPACTFUL TEAMS
If we look at the most impactful teams in terms of set pieces, we tend to look at the goals scored, as that is what you try to achieve with it. In the graph below you can see this.

In the graph above you see the Eredivisie teams and the corresponding goals scored from corners. It’s interesting to see that 4 out of the 5 top teams in the League, also feature in the top 4 for corners goals scored in the 21/22 Eredivisie season.

As you can see, we see the percentage of all goals scored with attacking corners. Go Ahead Eagles has the most impact via attacking corners goals with nearly 25%. AZ and Feyenoord score high, but it’s remarkable that more lower placed teams, do have a higher percentage. RKC and PEC Zwolle lacked that impact with 5% and 3,85%.
TEAMS: EXPECTED GOALS ON TARGET PER ZONE
In this section we are going to look more closely at each team and which zones they targeted — which zone gave the most expected goals on target (xGOT)?
Ajax

In the visual above you can see where Ajax created the most xGOT. 41% of the xGOT in corners has come from the area at the right post. Most of the xGOT is in and around the six-yard area, indicating they want to have high-quality chances of scoring from corners.
AZ

In the visual above you can see where AZ created the most xGOT. 29% of the xGOT in corners has come from the area at the left post, but also 26% at the right post. Most of the xGOT is in the the six-yard area, indicating they have high quality chances there. What’s interesting is that they have xGOT outside the penalty area.
Cambuur

In the visual above you can see where Cambuur created the most xGOT. 57% of the xGOT in corners has come from the area at the left post, but also 25% at the right post. Most of the xGOT is in the six-yard area, indicating they have high quality chances there. What’s interesting is that they have little to know xGOT outside the six-yard box.
Feyenoord

In the visual above you can see where Feyenoord created the most xGOT. 32% of the xGOT in corners has come from the area at the right post, but also 25% at the left post. Most of the xGOT is in the the six-yard area, indicating they have high quality chances there, but they also have 15% in the right side of the penalty spot. The 4% from far out is fascinating.
Fortuna Sittard

In the visual above you can see where Fortuna Sittard created the most xGOT. 29% of the xGOT in corners has come from the area at the left post, but also 17% at the right post and 20% right of the penatly spot. Most of the xGOT is in and around the six-yard area, indicating they have high quality chances there. What’s interesting is that they have xGOT outside the penalty area from the left corner side, as they had shots on target from that area and even scoring from there.
Go Ahead Eagles

In the visual above you can see where Go Ahead Eagles created the most xGOT. 43% of the xGOT in corners has come from the area at the left post. The two zones after that are on the right side of the penalty spot with 17% and 20%. The distribution of the different zones do seem to indicate a difference in delivery.
FC Groningen

In the visual above you can see where FC Groningen created the most xGOT. 38% of the xGOT in corners has come from the area at the left from the penalty spot, but also 29% at the right of the penalty. Most of the xGOT is generated from there and considering the lower percentages higher or deeper, it’s like that the deliveries were outswingers or deep inswingers.
SC Heerenveen

In the visual above you can see where Heerenveen created the most xGOT. 28% of the xGOT in corners has come from the area at the right post, but also 24% right from the penalty spot. What’s also interesting is that 15% of xGOT also comes from the edge of the penalty area on the right, an indication of a deeper play.
Heracles Almelo

In the visual above you can see where Heracles Almelo created the most xGOT. 36% of the xGOT in corners has come from the area right from the penalty spot, but also 34% at the left area from the penalty spot. Most of the xGOT comes from the areas near the penalty spot, but all the other areas do have a lower percentage. They, however, indicate a variety of deliveries.
NEC Nijmegen

In the visual above you can see where NEC created the most xGOT. 49% of the xGOT in corners has come from the area left from the penalty spot, but also 18% at the left post. A significant percentage (12%) comes the area on the left outside the penalty area.
PEC Zwolle

In the visual above you can see where PEC Zwolle created the most xGOT. 43% of the xGOT in corners has come from the area at the left post, but also 14% at the area next to the right post area. Most of the xGOT is in the six-yard area, indicating they have high-quality chances there. What’s interesting is that the area next to the penalty spot on the right, has 14% of the xGOT.
PSV

In the visual above you can see where PSV created the most xGOT. 21% of the xGOT in corners has come from the area at the left post, but also 31% at the area right from the penalty spot. Most of the xGOT is generated in the four areas closest to the goal, with a total of 70% of the xGOT coming from there.
RKC Waalwijk

In the visual above you can see where RKC created the most xGOT. There us one area where the majority of the xGOT is generated and that is the area at the right post with 61% of total xGOT.
Sparta Rotterdam

In the visual above you can see where Sparta created the most xGOT. In all the four areas right in front of the goal, Sparta created a significant percentage of the xGOT. Together it represents 87% of the generated xGOT of Sparta Rotterdam.
FC Twente

In the visual above you can see where FC Twente created the most xGOT. 24% is on the left post and 25%, just outside that area. Deeper in the penalty there has been generated a significant amount of xGOT as well. This indicates the diversity in shot locations as well as diverse strengths in quality shots.
FC Utrecht

In the visual above you can see where FC Utrecht created the most xGOT. 65% of the xGOT was generated from inside the six-yard box, with 20% of the xGOT generated on the right side of the penalty spot. The xGOT is very focused close to goal.
Vitesse

In the visual above you can see where Vitese created the most xGOT. While there are different areas where xGOT is generated, the focus and majority of the xGOT (52%) comes from the area at the left post. There is xGOT on the areas both sides of the penalty spot, but not as significant as we have seen in the left post area.
Willem II

In the visual above you can see where Willem II created the most xGOT. 38% comes from the right post area and 32% comes from the area on the left of the penalty spot. Away from the right post area there is 22% xGOT generated, but those are the most significant areas for Willem II in corners.
TEAMS: SUCCESSFUL ROUTINES PER TEAM
Ajax

The zone on the right post and in this instance the near post is the zone where Ajax generated the most xGOT. In this case Martinez comes to that area against Vitesse’s zonal structure and heads the ball towards the far corner.
AZ

The zone on the left post and the near post is the area where the most xGOT is generated by AZ. They attack it well here with runners against a zonal structure and head the ball in goal.
Cambuur

For Cambuur, the most attacked zone is the left post zone, which is frequently the near post zone/area from the left. Against the zonal structure they time their runs well and score a goal from that particular area.
Feyenoord

For Feyenoord, the most attacked zone is the right post. Here it’s illustrated with a corner from the left going deep into the far post zone. Linssen times his run well and heads the ball in goal, with most players going to the front post.
Fortuna Sittard

For Fortuna Sittard, the most attacked zone is the left post. Here it’s illustrated with a corner from the right going deep into the far post zone. Scored by Gladon in the zone between the far post zone and the zone there after.
Go Ahead Eagles

Go Ahead Eagles create many high-quality chances and xGOT from the left post. They didn’t do that with direct contact, but with the second or third contact. This can also be seen in this particular example.
FC Groningen

The zone behind the left post zone is the zone where Groningen generates the most xGOT from. In this example they don’t score from a direct contact from a corner, but from the second phase of the corner — good finish.
SC Heerenveen

For SC Heerenveen, the right post is where most of the XGOT is generated. This header goal illustrates the threat from this particulra zone against Willem II.
Heracles Almelo

For Heracles Almelo, the zones behind the six-yard box are the zones where most xGOT is generated. The initial shot doesn’t go in, but that’s where threat comes from and eventually they score.
NEC

In the zone just behind the left post, is the zone where NEC generates the most xGOT. In this particular corner, the ball goes that particular area just behind the near post and the ball is guided to the far post.
PEC Zwolle

For PEC Zwolle, the left post zone is where they generated the most xGOT — but since they have scored one goal from a corner, here is an example of how they attacked the far post. Something they also do from the right.
PSV

Not always a first contact is needed to score a goal. Even in third phase of the corner, PSV keep on pressing. It’s this particular shot zone, where PSV is very dangerous and can hurt the opposition.
RKC

For RKC, the zone with the right post is very important in generating xGOT. In this corner, they play it deeper and head it towards the near post — where Kramer is situated to slot the ball home.
Sparta Rotterdam

For Sparta it’s all about being as close to the six-yard box as possible. This is also done in this corner, as the second phase leads to a cross into the six-yard box and having someone there increases the chance of scoring.
FC Twente

FC Twente generates the most xGOT in the areas left from the left post, in which they try to shoot. They have people on the left side, making sure they can attack those areas as they are left with space.
FC Utrecht

FC Utrecht like to shoot from the right post, as that is where they generate the most xGOT. With corners from the right, this means that the near post will be occupied and shot from — as you can see in this game.
Vitesse

Vitesse likes to attack and generate the most xGOT from the left post zone. You can see that here in the corner from the left side, meaning the ball will swing into the near post zone — and they score form.
Willem II

Willem II had the most xGOT generated on the right post and that is the zone they like to attack with corners. Here they are in the second phase of the corner and make sure someone has a run into the far post.
FINAL THOUGHTS
It’s interesting to look at all the data in front of us and do the actual eye test as well. We want to define and look for threats in the penalty area and in this particular article, I’ve tried to use xGOT as an instrument to analyse what the most threatening zone is while having an attacking corner. We could identify which zones that are per team, but does it also mean that those are the areas/zones the team score from? Not necessarily if I’m being honest.
With many teams this corresponds with each other, but it measures where the chance of scoring is highest according to shots on target. It’s only natural that more goals will be scored from there, but it’s not a given. This you can see with lower ranked teams, who aren’t as good in direct contacts.
The idea that lower ranked teams have a bigger percentage of destined places and direct contacts, can be debunked for a part. Yes, usually set piece are a big share of their scored goals, but the diversity in shot locations and routines, is not to be underestimated.
CASE STUDY GOALS ADDED (G+): SOPHIA SMITH IN THE NWSL
The world of women’s football has been growing a lot in the last decade, but we can see another innovative progression after the Euro 2022 in England. We are now at a crossroads in women’s football where investment is growing all across the board, which also means that the margins are becoming smaller and details are much more important.
This is also the case in the world of analysis. How do we make sure that our players/teams/leagues have that edge over the competition? It means analysis in the margins and that also means looking at theoretical concepts and the practical outcome. I wanted to do this whilst looking at the NWSL in the United States in the 2022 season.
The metric I have chosen is goals added (G+) and the player I have chosen for this case study is Sophia Smith. Smith is an exciting talent and it would be interesting to me to see how she does in this specific metric that adds value to each action in terms of the ultimate goal: scoring goals.
DATA
This is a data analysis of Sophia Smith’s season in the 2022 NWSL, but it also focuses on the overall performances of players in terms of goals added. The database contains all players with minutes in the 2022 NWSL season with an emphasis on attacking and creative players.
The data was collected on November 14th 2022 and has been collected from American Soccer Analysis, who have calculated their own data in terms of expected goals, expected passing and goals added — the latter is what we will focus on.
SOPHIA SMITH

- Name: Sophia Smith
- Date of birth: 10–08–2000
- Nationality: American
- Position: Attacker
- Current club: Portland Thorns
- Previous clubs: Stanford (Y)
- International: United States(27 games)
Sophia Smith was drafted in the first round of the 2020 NWSL draft and has played for Stanford before. In Portland, she has grown into a full senior international in the US team, as well as a seasoned player in the NWSL. In 18 games in the 2022 NWSL season, she managed to score 14 goals and give 3 assists, meaning that she was involved in 1,31 goal contributing actions every 90 minutes.
She has been instrumental into Portland Thorns’ championship in 2022 and has scored many important goals in the process. In this analysis we want to find an answer to the question: how much value does she bring to the team and the league, by assigning values to her actions with the theory of goals added (G+).
GOALS ADDED
American Soccer Analysis created the goals added metric to assign values to each action into an attacking phase or defensive phase. They explain it like this on their website:
“Goals added (g+) measures a player’s total on-ball contribution in attack and defense. It does this by calculating how much each touch changes their team’s chances of scoring and conceding across two possessions.
For example, at the moment a player receives the ball at midfield, their team might have a 1.5% chance of scoring on that possession but also a 1% chance of conceding on the next possession. That situation isn’t very valuable. But if they play a throughball from there into the final third, their team is now in a much better situation and might have a 6% chance of scoring and only a 0.5% chance of conceding. The pass would be worth the difference in their team’s situation before and after it, or (0.060–0.005) — (0.015–0.010) = +0.050 goals added.
Goals added only looks at the likelihood of goals. It doesn’t give players any credit for actually scoring. So a striker will be rewarded for finding space to receive a pass in a good position and may earn some shot value for turning a possession into a shot on target, but that value won’t change depending on whether the goalkeeper saves the ball. This keeps the model from assigning too much importance to finishing, which statistically is almost random, and instead rewards actions that consistently lead to goals.”
If you want to read more about it, you can read it on the American Soccer Analysis website, here and here.
Goals added can both work in attacking sense as in defensive sense, but we will only focus on the attacking one. The reason why we have chosen for that is that we want to measure the value of the attacking actions of Sophia Smith in the chain of events toward the likelihood of scoring a goal.
Goals added can be divided into the following categories:
- Shooting: how much does shooting contribute to goals added?
- Receiving: how much does receiving the ball after a pass contribute to goals added in the whole chain?
- Passing: how much does passing the ball (+receiver) contribute to goals added?
- Dribbling: how much does dribbling, take-ons and carrying the ball contribute to goals added in attack?
- Interrupting: how much do interceptions, tackles, blocks, clearances, recoveries, and contested headers contribute to goals added?
- Fouls: fouls committed and received
These categories will feature in the data analysis and visualisation that will be done below.
ANALYSIS
Before delving into the actual analysis, it’s important to make sure that the database is representative of the quality and level of the league. A player with 900+ minutes will be more representative than someone with 50 minutes in the 2022 season. Our complete database consists of 286 players of which goals added is recorded/collected.
This means that we have made a cut-off in terms of minutes. We have made it the equivalent of 5+ games and decided to take 500 minutes played as the minimum. This means that our database shrinks from 286 players to 196 players who are eligible/representative for our research.
In this analysis we will first refer to the goals added (G+) in relation to the minutes played to show the representation. After that, we will refer to the specific aspect of goals added to the total goals added.
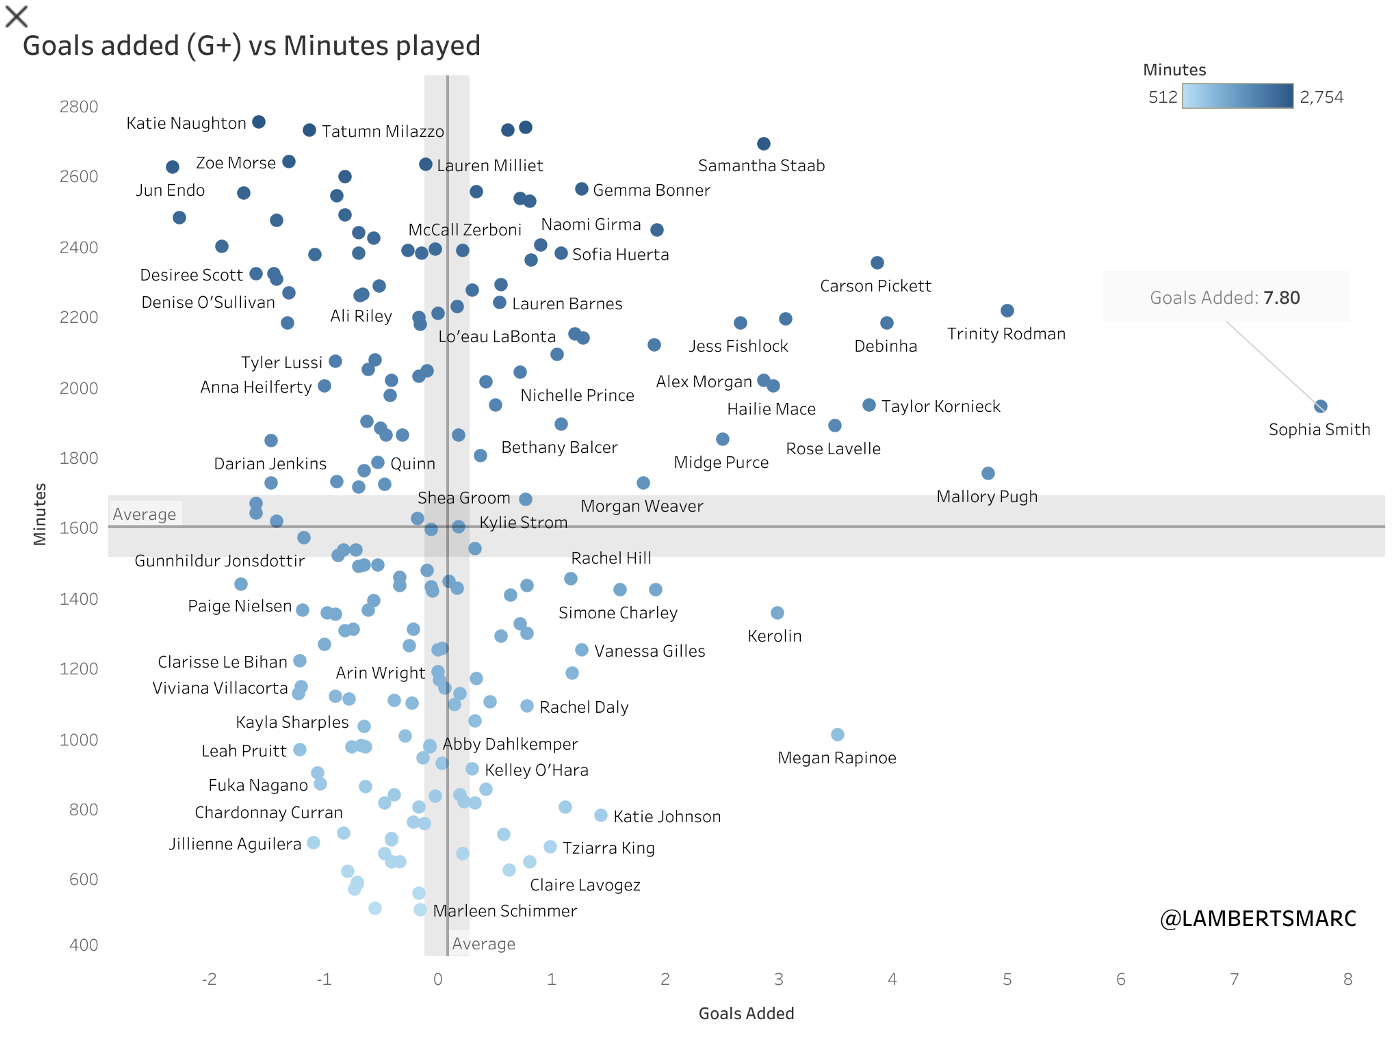
In the scatterplot above you can see the total of goals added in relation to the minutes played. The average minutes played are 1603 minutes and the average of goals added is 0,08 goals added.
With goals added we measure the actions that contribute to the likelihood of a goals scored, but it definitely looks at multiple actions in comparison to expected goals. If we look closer to Sophia Smits we can see she has above average minutes with 1945 minutes, but has the highest goals added of the whole NWSL in the 2022 season with 7,8 goals added over the whole season. What does this mean? In the whole season, her attacking actions have contributed to the likelihood of 7,8 goals being scored.

In the scatterplot above you can see the shooting (G+) in relation to the total of goals added. The average shooting (G+) is 0,02 and the average of goals added is 0,08 goals added.
Sophia Smith scores very high on the goals added metric as shown above, but she also is by far the best in accumulating shooting (G+) with 1,85 shooting (G+). The next player coming close to her is Alex Morgan with 1,18.
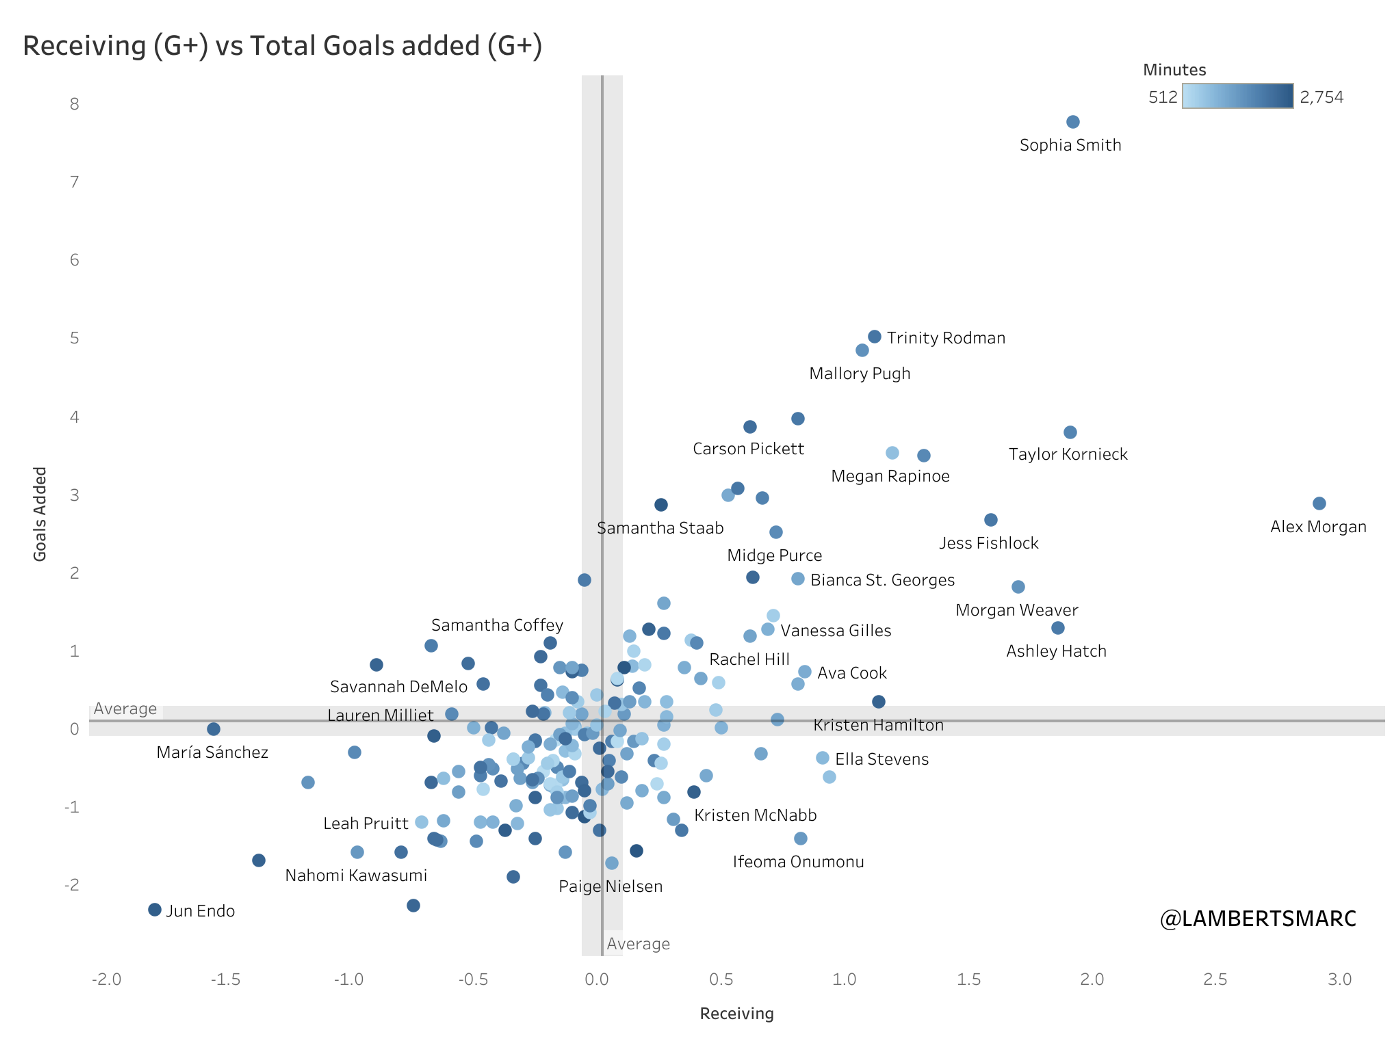
In the scatterplot above you can see the receiving (G+) in relation to the total of goals added. The average receiving (G+) is 0,02 and the average of goals added is 0,08 goals added.
Sophia Smith scores very high on the goals added metric as shown above, but she isn’t the best in the metrics of receiving (G+). She has 1,92 receiving G+, which is the second highest in the database after Alex Morgan. Taylor Kornieck (1,91) and Ashley Hatch (1,86) follow closely.
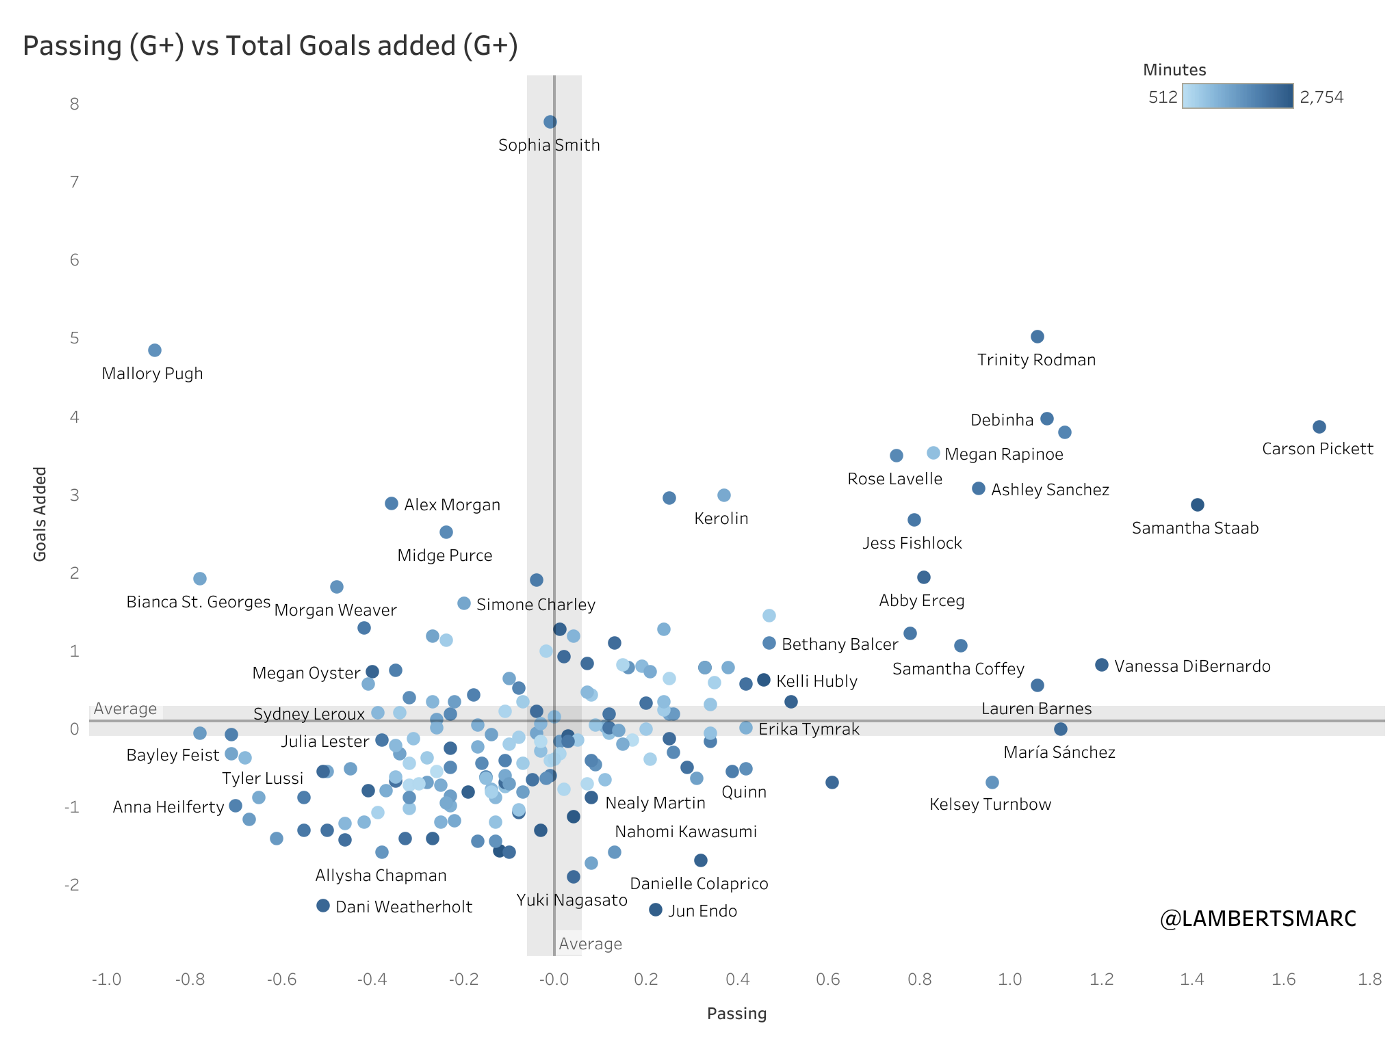
In the scatterplot above you can see the passing (G+) in relation to the total of goals added. The average passing (G+) is 0 and the average of goals added is 0,08 goals added.
Sophia Smith scores very high on the goals added metric as shown above, but she doesn’t score high in the passing (G+). In fact she scores below average with -0,01 and there are many players scoring higher than her on the passing (G+) in the 2022 NWSL season.
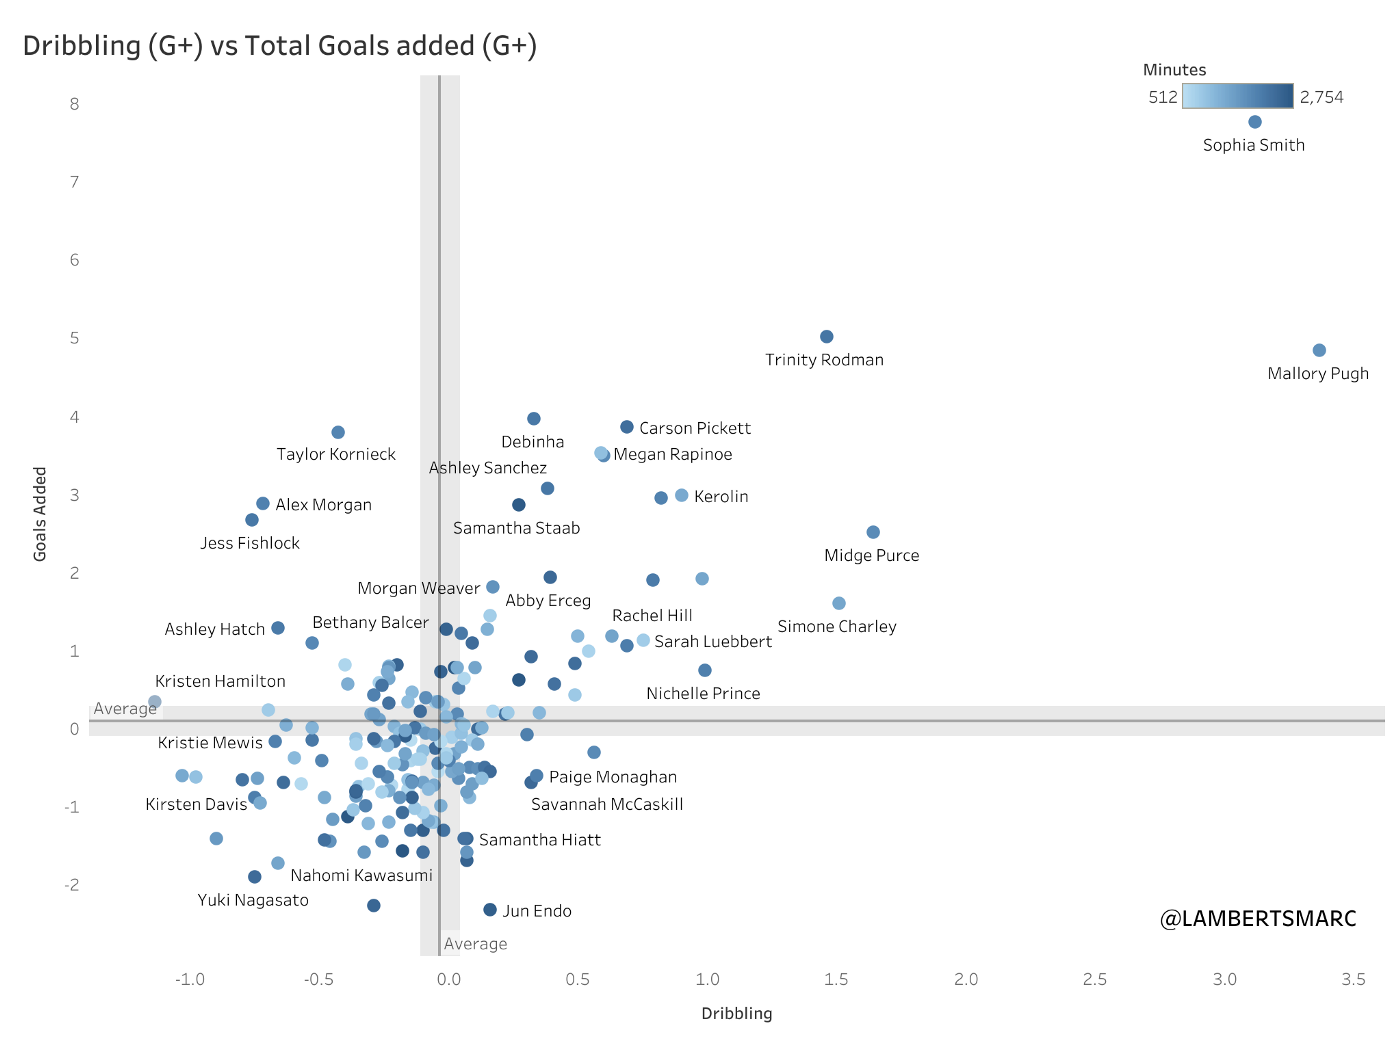
In the scatterplot above you can see the dribbling (G+) in relation to the total of goals added. The average dribbling (G+) is -0,04 and the average of goals added is 0,08 goals added.
Sophia Smith scores very high on the goals added metric as shown above, and she scores very high on the dribbling metric as well. She is second after Mallory Pugh, with 3,12 dribbling G+. The high number indicates that this is a significant part of her total goals added.
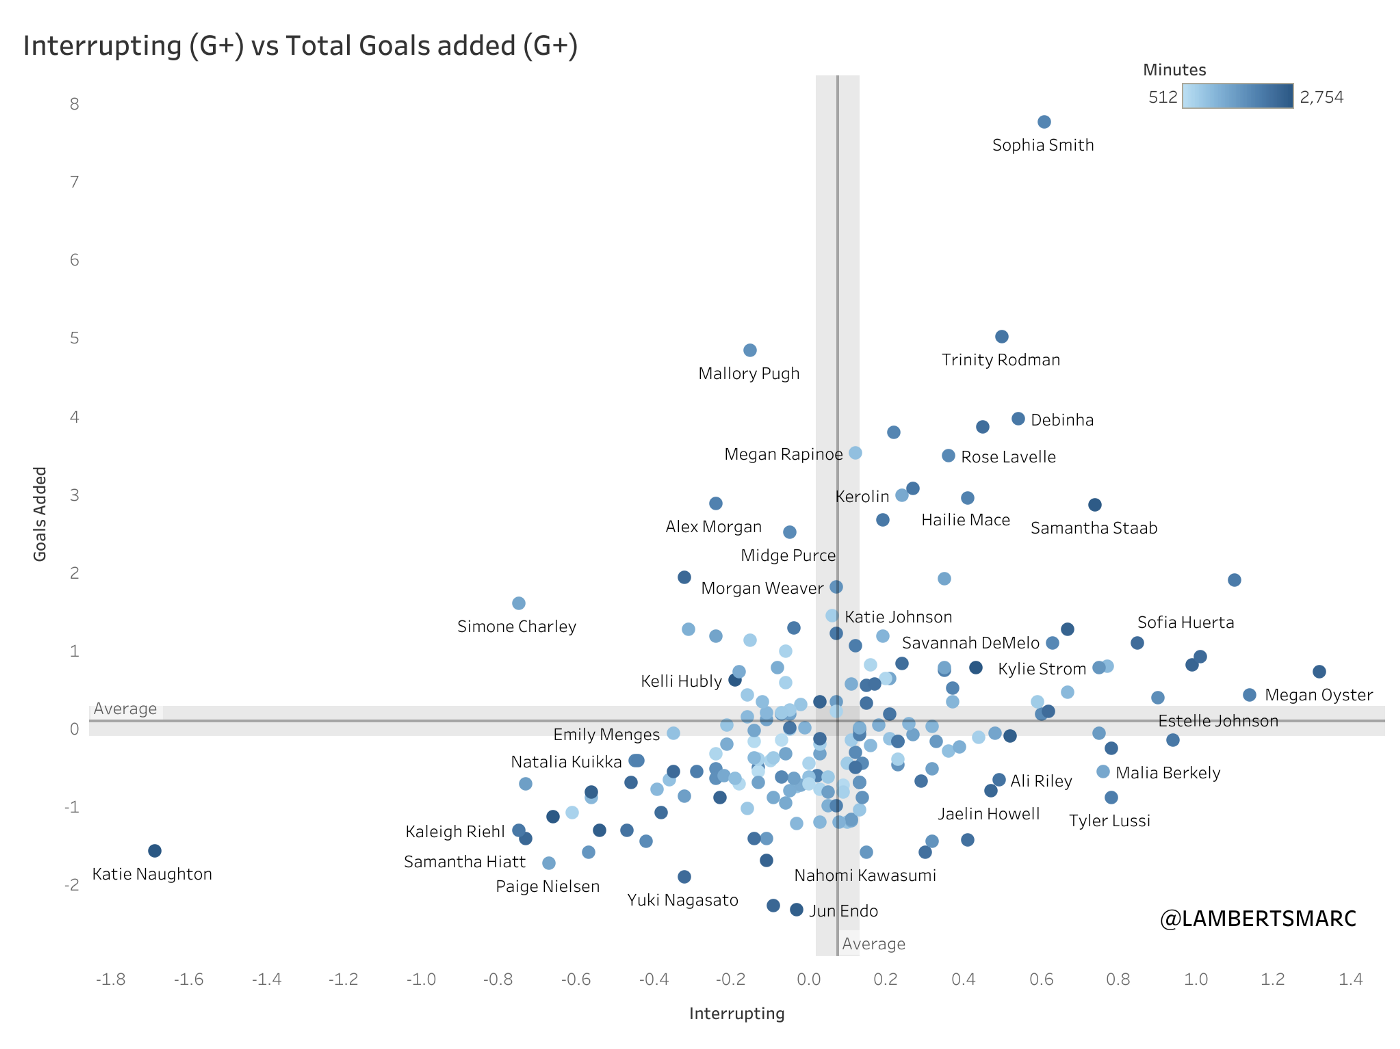
In the scatterplot above you can see the interrupting (G+) in relation to the total of goals added. The average interrupting (G+) is 0,08 and the average of goals added is 0,08 goals added.
Sophia Smith scores very high on the goals added metric as shown above, and she scores quite high on the interrupting (G+) as well with 0,61 interrupting G+. 20 players score higher than her, meaning that she is in the high average for this metric.
FINAL THOUGHTS
With goals added we can assign values to attacking actions within a chain of events for every player. We can see that Sophia Smith has 7,80 G+ in total, but these are mostly generated in shooting, receiving and dribbling. Passing isn’t as impactful and interrupting is in the high average.
From this information, we can say that her threat and contribution going forward, mostly come from her shots, where she receives passes, and her ability to dribble/carry the ball — which makes her one of the highest performers in these metrics. Overall, she scores highest with 7,80 G+ in the 2022 NWSL.
XAVI SIMONS – SCOUT REPORT 22/23
We have played 10 games in the Dutch Eredivisie in the 2022/2023 season. Perhaps it’s too early to talk about crucial performances and measuring quality depending on this season alone, but we can look closer to some players and how their first impression is in this season. One of the players I was anxious and excited to see, was Xavi Simons at PSV.
Under Ruud van Nistelrooij, Xavi Simons has been instrumental in their success in attack as well as providing creativity in the opposition’s half. It has been 10 games in the season, but next to the wonderful Gakpo, Simons has played a huge part in how PSV conduct their attacks.
We will use data and video to illustrate how Simons has done in the Eredivisie 2022/2023 so far and we will focus on the attacking positions.
CONTENTS
- Biography
- Seasonal stats
- Ball progression
- Key passing
- Shooting
- Assists
- Final thoughts
Biography

- Name: Xavi Simons
- Date of birth: 21–04–2003
- Nationality: Dutch
- Position: Attacking midfielders
- Contract expires: 30–6–2027
- Current club: PSV
- Previous clubs: Barcelona (Y), PSG (Y), PSG
- International: Netherlands U21 (2 games)
Xavi Simons is a wildly interesting player for PSV. Characterised as an midfielder with good on the ball abilities in passing and carrying, the young Dutch player also plays in the number 10 role or as a winger. Yesterday in the game against Arsenal we even saw him briefly as a striker. To make a long story short, he is a versatile attacking talent and is taking the Eredivisie by storm.
Seasonal stats

In the pizzaplot above you can see how Xavi Simons is performing against all midfielders in the 2022/2023 Eredivisie so far. This pizzaplot doesn’t give us a definitive judgment on how he performs, but gives us a stylistic overview of his data profile.
We will go into details for the specific stats later for the absolute data, but in this part, we will look at how well he is doing in certain metrics and what that tells us about his playing style.
What we immediately see is that he scores really high in the attacking metrics, especially on goals (99th percentile), xG (99th percentile), assists (94th percentile), and progressive runs (91st percentile). This tells us that he is very attacking-minded for a midfielder.
When we look closer to what he can do when we look at the more attacking profiles compared to wingers, attacking midfielders and strikers – we can see some interesting stuff there too.

When we look at this comparison we can still see how high Simons scores in goals per 90 (93rd percentile), xG per 90 (91st percentile) and in shots per 90 (86th percentile). This indicates that his participation and style in attacking, is quite present in the attacking phase of the game.
Ball progression

The modern attacker isn’t only concerned with dribbling and crosses — but he/she also needs to be comfortable on the ball and progress play from it.
In the scatterplot above you can see the progressive metrics of progressive passes per 90 and progressive runs per 90. Simons does quite well here as he scores jjust above average in the progressive passes metric, and quite comfortably above average in the progressive runs metric. There are a few players better in progressing the ball, so he isn’t elite in this regard.
Dribbling
DRIBBLING

So how decent is he with the ball on his feet and going into the 1v1s? In other words, how many dribbles does he have per 90 minutes and what is his success rate?
If you look at the graph above you can see that he 4,75 dribbles per 90 in the Eredivisie so far, in which he scores above the average. When we look at the successful dribbles going with that number of dribbles, he has 50,78% – which is above average, but he doesn’t excel in it.
Xavi Simons is decent at dribbling, but how does he do that? You can see that in the video below.
KEY PASSING
Every player makes passes in a game, but which passes actively contribute to the progression and construction of an attack? You can see some of these metrics in the beeswarmplot below.

As you can see in the graph above, Simons scores in the average to high average in almost every metric. There is not one significant metric where he doesn’t score as well. However, he scores excellent in the assists per 90 metrics.

As you can see in the heat map of passes above, Simons does the majority of his passes on the edge of the attacking third and in the middle third. As we see here is that he passes the ball overwhelmingly in the central areas and zone 14, so he also can go to the right and left – as he floats throughout the final third.
What’s interesting is how he makes key passes. He scores in the high average, but the intent of his through passes does tell a lot about how he can help in an attack.
SHOOTING
Simons does often come in the position to shoot, but how does he do in the quality of shooting?

In the shot map above you can see where Simons has conducted his shots in the 2022/2023 Eredivisie season so far. He had 25 shots of which 7 went in goal. 88% of his shots were on target and he generated a total xG of 4,43 — the latter meaning that he is overperforming with +2,57.
Apart from shooting in the box, he loves to shoot from just outside the penalty area – on the edge of it. It indicates that he loves to come into zone 14 and execute shots from there.
ASSISTS
Not only did he score a lot in the Eredivisie, but he also provided 3 assists during the season. In the video below you can see his assists during the season in all competitions.
FINAL THOUGHTS
It was quite a surprise that Xavi Simons made the move to PSV from PSG and it wasn’t on loan. For many people, he was the academy player that hadn’t shown his quality yet for the senior sides. I think it’s fair to say that he has made an impact with PSV in the Eredivisie so far.
It’s very early in the season, but it looks like Xavi Simons can lead an attacking formation next to Gakpo and have a meaningful goal contribution in doing so. He will be one of the best players in the league soon and perhaps his path in Europe’s elite will be open again.
CODY GAKPO — SCOUT REPORT 21/22
A disappointing result for Dutch football last night was when PSV lost their game against Rangers and failed to qualify for the Champions League. Not only will we see PSV in the Europa League, but it has also increased the likelihood that Cody Gakpo might make a move to the Premier League.
In this article, we will look closer to his 2021/2022 Eredivisie season with PSV.
Cody Gakpo has been instrumental for PSV in attacking in the 2021/2022 season and was one of the focal points in the attack. He can be considered as a great finisher, but also a top creator amongst his peer in the Eredivisie. An exciting talent who is ready for that next step.
We will use data and video to illustrate how Gakpo has done in the Eredivisie 2021/2022 and we will focus on the winger position as well as the striker position.
CONTENTS
- Biography
- Seasonal stats
- Positions/roles
- Ball progression
- Dribbling
- Expected threat
- Key passing
- Shooting
- Assisting
- Expected goal contribution
- Comparison with Antony
- Final thoughts
BIOGRAPHY

- Name: Cody Gakpo
- Date of birth: 07–05–1999
- Nationality: Dutch
- Position: Left winger/striker
- Contract expires: 30–6–2026
- Current club: PSV
- Previous clubs: PSV (Y)
- International: The Netherlands (7 games)
The question is when we look at Gakpo: what profile does he have? He is good at scoring goals and providing assists. He is good in the air and can link up pretty well. These things might suggest he could do a fantastic job as a striker.
But, if we look at the game he played in domestic competition — the 5–3
Supercup win in the Netherlands — he was more winger with playmaking abilities. He collected the ball in the middle third, dribbled, and made a run down the line. and then won the 1v1 against the right full back. After he had done that he would either cut inside or go the line — providing crosses to Guus Til — who scored twice on a good cross from Gakpo.
Then, we could also argue that in the same game he has shown striker’s instinct. After the Ajax goalkeeper couldn’t handle a shot from distance, Gakpo moved quickly to get the rebound and score a goal. If this says anything, it is that we should put him in one or the other box. We should celebrate his diversity and versatility on the pitch.
The big question is, how will he fit in at a team like Manchester United? And do they really need him? With Ten Hag, Manchester United have started to play a different brand of football and there’s something in particular asked from the wingers and the strikers.
He is not a pure winger, but a modern winger with playmaking skills and that can come in handy at Manchester United. He is a whole different player than Antony for example, but both have their qualities. While Antony is more direct in his play and wants to draw defenders to get that 1v1 going, Gakpo will try to involve more teammates and use a passing style of play to get to the optimal positions to great a goalscoring opportunity.
SEASONAL STATS

If we look at this specific pizza plot, we can say a few things. But before we turn into the meaning, it’s good to stress that this mostly gives us a stylistic idea of the player rather than a definitive performance one.
What we can see is that there are three metrics in which he scores under the 86th percentile: shots on target %, head goals per 90, and successful dribbles %. In all the other metrics he scored in the 86th percentile or higher. In the xA per 90 (96th percentile), assists per 90 (98th percentile), goals per 90 (92nd percentile), and progressive runs per 90 (91st percentile) — he really shows why he is spoken about so much.

In the image above you can see how Gakpo compares to his peers on the data metrics selected. The average is in blue and Gakpo in red. Gakpo is better in all but two metrics. In the metrics of head goals per 90 and shots on target % — he scores under average.
Positions/roles

In the image above you can see the positions in a 4–2–3–1 where Gakpo can play. He is the best suited for the wide midfield/wingers role, where he needs to make runs down the line and in doing so provides passes for the attackers in PSV side or cut inside and shoot himself. He can also play the striker role in this formation with movement to the wide areas.
In the image above you can see a 4–2–3–1, but he can play as a wide midfielder in a 4–4–2, 4–5–1 or 4–1–4–1 too. If you play with three attackers in a 4–3–3, he will play higher up the pitch as a left winger.
BALL PROGRESSION

The modern winger isn’t only concerned with dribbling and crosses — but he/she also needs to be comfortable on the ball and progress play from it.
In the scatterplot above you can see the progressive metrics of progressive passes per 90 and progressive runs per 90. Gakpo does really well here as he scores above average in the progressive passes metric, and above the progressive runs metric. There are only a few players better in progressing the ball.
DRIBBLING
Gakpo is excellent at dribbling, but how does he rank to others in this metric?

In the scatterplot above you can see how well the player are scoring in terms of volume of dribbling and the success rate of those dribbles. As you can Gakpo has the most dribbles per 90 of all the attackers, and while he hasn’t the highest percentage of completed dribbles — he is in the top tier for both these metrics.
EXPECTED THREAT (XT)
The basic idea behind xT is to divide the pitch into a grid, with each cell assigned a probability of an action initiated there to result in a goal in the next N actions. This approach allows us to value not only parts of the pitch from which scoring directly is more likely, but also those from which an assist is most likely to happen. Actions that move the ball, such as passes and dribbles (also referred to as ball carries), can then be valued based solely on their start and end points, by taking the difference in xT between the start and end cell. Basically, this term tells us which option a player is most likely to choose when in a certain cell, and how valuable those options are. The latter term is the one that allows xT to credit valuable passes that enable further actions such as key passes and shots. (Soccerment)
So how does Gakpo contribute to attacking threat in the Eredivisie?

If we look at all these actions we can see Gakpo is the second on the list of highest xT generated throughout the season via carries. He has an xT of 2,00. Only Tavsan (2,66) is better.
KEY PASSING
Every player makes passes in a game, but which passes actively contribute to the progression and construction of an attack? You can see some of these metrics in the beeswarm plot below.

As you can see in the graph above, Gakpo scores quite high above average in almost every metric, only not the passes to the final third. He scores excellent in the assists per 90, xA per 90, and passes to the penalty area per 90.
What’s interesting is how he makes key passes. He scores in the high average, but the intent of his through passes does tell a lot about how he can help in an attack.
SHOOTING

In the scatterplot above you can see the metrics of shots per 90 and expected goals per 90 combined. as you can Gakpo scores above average for both metrics, with only a few player scoring above him.

When we look at the expected goals and the actual goals we see that he averages 0,46 xG per 90 and 0,53 goals per 90 — this means that he is slightly overperforming on his xG.
Gakpo does sometimes come in the position to shoot, but how does he do in the quality of shooting?

In the shot map above you can see from where Gakpo has conducted his shots in the 2021/2022 Eredivisie season. He had 81 shots of which 12 went in goal. 35,8% of his shots were on target and he generated a total xG of 10,52 — the latter meaning that he is overperforming with +1,48.
Apart from shooting in the box, he loves to shoot from the left side inside the penalty box. More than half of his shots come from this area.
ASSISTS

In the scatterplot above you can see shot assists and expected assists combined. A shot assist is a pass that leads to a shot. This can lead to an actual assist but it doesn’t always have to. As you can Gakpo is in the top 3 in both these metrics, with Mahi and Tadic trumping him in one of the metrics.
Not only did he score a lot in the Eredivisie, but he also provided 12 assists during the season.

As you can see he has an expected assists number of 0,37 per 90 and while others do score better on that front, he has an actual assist number of 0,53 per 90 — which means he is overperforming quite significantly per 90 minutes.
EXPECTED GOAL CONTRIBUTIONS

If we look at the expected goal contributions per 90 minutes we can see something very interesting. Gakpo is expected to contribute to roughly 0,82 goals per 90 minutes. Which in this case makes him one of the more complete strikers, because he seems to be equally good in finishing as in creating — which makes him a rather unique player.
COMPARISON WITH ANTONY

Frequently spoken about is the comparison between Gakpo and Antony. While they are two very different players and Gakpo likes to engage more in passing and Antony more in 1v1s — it’s interesting to see what their output is. Gakpo scores better in the data on all but two metrics: progressive runs per 90 and shots per 90. In all the other data metrics — Gakpo scores higher.
FINAL THOUGHTS
Cody Gakpo has had a great season with his PSV, but there is always the question of whether he can show in the top domestic games or in Europe. And, rightfully so. Domestically, however, he has become a very prolific player in both goals and assists. He also poses a great threat to any defence with his pace, 1v1s, and dribbles.
In terms of providing and contributing directly to a goal, he does really well with his goals and assists. Will he be the answer to Manchester United’s woes on the flanks? Probably not, but he will provide squad depth that will absolutely contribute to their attacking play.
IBRAHIM SANGARÉ – SCOUT REPORT 21/22
I remember the final days of the summer transfer market in 2020. PSV managed to sign Mario Götze and Ibrahim Sangare. While we don’t have to share Götze’s story, the majority of the Dutch Eredivisie fans, and in particular PSV fans, had absolutely no idea who they signed.
Now, I don’t pride myself in a lot — but seeing Sangare moving from a relegated Toulouse side to a title contender in the Netherlands, I was so excited. And with me, a lot of data nerds and football manager aficionados. The defensive midfielder was rumored to be great and even make the step to a bigger league, but he has done remarkably well in the Eredivisie.
In this scout report I will go into detail about his 2021/2022 Eredivisie season, concentrating on the following aspects:
- Biography
- Seasonal stats
- Positions/roles
- Defensive qualities
- Ball progression
- Key passing
- Shooting
- Comparison with Eredivisie peers
- Final thoughts
BIOGRAPHY
- Name: Ibrahim Sangaré
- Date of birth: 02–12–1997
- Nationality: Ivory Coast
- Position: Defensive midfielder, central midfielder
- Contract expires: 30–6–2025
- Current club: PSV Eindhoven
- Previous clubs: AS Denguele, Toulouse
- Current international: Ivory Coast
Sangaré is a defensive midfielder who works incredibly hard and can be seen a machine in the defensive aspect of the game. He often plays in the defensive midfield paired with another central midfielder, as the double pivot.
He’s an impressive midfielder to come across with a physique to match that image. He’s a player that will demand presence and will easily gravitate toward the ball. But he’s more than just a strong physical presence, he does very well in progressing the ball from the defensive third into the middle third by carrying it.
His passing profile allows him to bring the ball into the final third to construct attacks in the final phase of attacking play. He is the best when he passes simple and straightforward, but does get himself into difficult situations when he tries complex passing.
While he is strong on the ball and progresses the play via passes, he does have difficulties in positioning himself well, when build-up starts from the back. He often seems lost or too conservative on the pitch, which leads to ineffective build-up. When the ball is higher up the pitch he links up well with passing triangles on either flank, as well as seeing runners from deep and reaching them with long balls.
SEASON STATS


In the images above you can see the absolute data of the midfielder profile of Ibrahim Sangaré. His data for a midfielder is compared to other defensive midfielders in the league or midfielders that have played in the defensive midfield during the 2021/2022 Eredivisie season.
As you can see Sangaré is an above-average defensive midfielder according to his data and only does under average in the metrics of PAdj sliding tackles per 90, xA per 90, and passes to the penalty area per 90.
But how does he fully compare to his peers in terms of data? You can see that in the graph below.

When we look at his season stats, we can see a few interesting things with Sangaré. In the graph above you can see a percentile radar of Sangaré based on a defensive midfielder template. It shows us how well Sangaré is doing in a certain data metric compared to his Eredivisie peers in the 2021/2022 season.
We will go into details for the specific stats later for the absolute data, but in this part, we will look at how well he is doing in certain metrics and what that tells us about his playing style.
He is an exceptional physical presence in the defensive midfield, what we can see in the data for defensive dues and aerial duels — scoring way above the 90th percentile in both metrics. While we look at the possession-adjusted metrics we can see that he scores very low on the tackles but very high on the interceptions. Now, this means that Sangaré can be characterised more as a proactive defensive midfielder than a reactive defensive midfielder.
In terms of passing, we see that he scores quite average on the expected assists metric and on the passes into the penalty area — but he he does very well in the passes to the final third metric, which tells us he wants to get the ball there. This is also backed up by the fact that his progression stats are very good, as he scores above the 80th percentile for this metric.
POSITIONS/ROLES
Looking for a player and we often want to see what position he or she plays. This is no different for Ibrahim Sangaré and in our minds, his physical profile along with his progression to the final third, he is a defensive midfielder.
But how has Roger Schmidt used him at PSV? What’s important for that, is to understand the formation the coach used at PSV and the idea of the role of Sangaré in that formation.

A commonly used formation in the Netherlands and across Europe is the 4–2–3–1 formation. In this formation, Sangaré would play in the double-pivot, usually on the left, with a more attacking player on the right (Veerman, Gutierrez, or Van Ginkel).

The same position was assumed for the 4–2–2–2 PSV employed. While the position is the same, the role for the progression of the ball changes. More responsibility is given to the double pivot for attacking actions as they need to participate more in the attacking play.

In the 4–3–3 occasionally used by PSV, the position and the role of Sangaré was different than the two examples above. In this role, Sangaré played a central midfielder on the left side and was more tasked with passing the ball into dangerous areas, rather than the defensive actions. It’s worth mentioning that he also played as a sole defensive midfielder, but his passing ability saw him used more progressive on the pitch.
DEFENSIVE ACTIONS
Sangaré is famous for his defensive actions as we have seen in the radars. The high percentage of successful duels both on the ground as in the air, make him one of the best — if not the best of the Eredivisie in his respective position.
So where does he conduct these defensive actions?

You can see that he recovers most of the balls on the left side between the middle third and the defensive third. The same area is roughly the area where he does intercept the ball, indicating his proactive thinking leads to recoveries of the ball. His tackling does happen all over the pitch and is mainly targeting at the last attempt to get the ball. The high volume of tackles in the opposition’s half indicates that these are attempts to break counter-attacks.
So how high does he score when looking at the defensive midfielders in the league? You can see that in the scatterplot below.

In the scatterplot above you can see how well he performs in terms of the PAdj metrics of sliding tackles and interceptions.
He doesn’t commit a lot to sliding tackles per 90 minutes, as you can see he scores below average with his 0,2 sliding tackles per 90 minutes. In terms of interceptions, he does score very high and above average. His 9,14 sliding tackles per 90 minutes are only bested by Edson Alvarez (Ajax).
In the video above you see a compilation of his defensive actions with PSV in several games. They light his ball recovering ability, his strength in defensive duels and in the defensive awareness of Sangare.
BALL PROGRESSION

The modern defensive midfielder isn’t only concerned with defending and producing defensive actions — but he/she also needs to be comfortable on the ball and progress play from it.
In the scatterplot above you can see the progressive metrics of progressive passes per 90 and progressive runs per 90. Sangare does really well here as he scores above average in both metrics. He is a complete player and finds himself surrounded by a player like Kökcü, who is another great prospect in the Eredivisie.
https://web.archive.org/web/20220926023706if_/https://player.vimeo.com/video/712372323?h=e305bea782&dnt=1&app_id=122963
Ball progression can have via different aspects of the game, but I wanted to look at his abilities on the long ball. He can use it to connect with the attacking third or to get out the press of the opposition.
In doing so, Sangare not only proves his defensive worth — but also manages to show the worth he has in terms of the progression of the attack and connecting the defensive lines to the attacking third.
KEY PASSING
Every player makes passes in a game, but which passes actively contribute to the progression and construction of an attack? You can see some of these metrics in the beeswarmplot below.

As you can see in the graph above, Sangaré scores quite average in the most metrics, but there are outliers. He doesn’t do as well in the xA and assists metrics but does very well in the passes to the final third metrics.
What’s interesting is how he makes through passes. He scores in the high average, but the intent of his through passes does tell a lot about how he can help in an attack.
https://web.archive.org/web/20220926023706if_/https://player.vimeo.com/video/712379322?h=1ac5959583&dnt=1&app_id=122963
When Sangaré comes higher up the pitch, he can be the player with the through pass that is a pre-assist/second assist. He opens up the play with his through passes. Yes, he does need the passing to be simple, but he is capable of complex passes and helping the attack.
SHOOTING
Sangaré does come in the position to shoot, but how does he do in the quality of shooting?

In the scatterplot below you can see the shots per 90 and the expected goals with those shots. This shows us the volume and the quality of the shots — it shows the likelihood of a shot being converted into a goal.
Sangaré does score above average on the volume of shots as well as in the quality of the shots. He has 1,31 shots per 90 and an xG of 0,15 per 90.

In the shot map above you can see from where Sangaré has conducted his shots in the 2021/2022 Eredivisie season. He had 38 shots of which 3 went in goal. 34,2% of his shots were on target and he generated a total xG of 4,22 — the latter meaning that he is slightly underperforming with -1,22.
Apart from shooting in the box, he loves to shoot from zone 14 — as that is the zone where comes frequently and tries to shoot from distance. He has scored twice from there and in the video below we will show some of his shots. I’ve also included games with Ivory Coast to give a more complete idea.
https://web.archive.org/web/20220926023706if_/https://player.vimeo.com/video/712391985?h=43ea253d82&dnt=1&app_id=122963
COMPARISON WITH PEERS
Now we have looked at the individual qualities of Sangaré, I would like to compare him to three defensive midfielders from rivals.

Compared to Alvarez from Ajax, you can see that in the defensive side of the game, Sangaré is superior. Only the PAdj sliding tackles and interceptions metrics is where Alvarez is better — but it’s impressive what the data says about this comparison.

The comparison with Kökcü is a bit off, as the Feyenoord midfielder plays higher up the pitch and his role is more attacking — but again, in the duels and PAdj metrics — Sangaré is better and provides a better defensive backing than his peer from Rotterdam.
ORKUN KÖKÇÜ — SCOUT REPORT 2021/2022
Feyenoord. One of the big clubs in the Netherlands with the potential to be the biggest club, but that’s where it is usually left: potential. This goes for results, but it is also used for the players that are full of talent. They are doing well, especially in the Eredivisie, but too few have made the step from being a talent into a great player in one of Europe’s top leagues. But, it seems that there is one player that could change that all: Orkun Kökçü.
Biography
- Name: Orkun Kökçü
- Date of birth: 19–12–2000
- Nationality: Turkish
- Position: Central midfielder, attacking midfielder
- Contract expires: 30–6–2025
- Current club: Feyenoord Rotterdam
- Previous clubs: FC Groningen (Y), Feyenoord (Y)
- Current international: Turkey
Theoretical Frame
With the theoretical frame, I try to look at what the scout report is meant to be saying about the player. In this case, I’m looking at the abilities of Kökçü in comparison to the league he most likely will go to. There have been rumors and interest from clubs in the English Premier League, so every claim and opinion in this piece will be in relation to his ability to play in that league.
The reason for this is that while Kökçü might be a top 5% player in the Netherlands or similar leagues, this might be completely different from other leagues. Not every good player in the Eredivisie will be a good player (instantly) in the Premier League and it’s important to keep that in mind when doing these reports.
Data and video collection
The data used in this scout report comes from different sources. The match data which will be used in graphs and plots come from Wyscout and contains Eredivisie results only from the 2021/2022 season. The reason why this is is to compare the players in this league to Kökçü and not every player will have played the same amount of international games for club or country — hence only the Eredivisie. He is compared to midfielders in the league.
The event data used in pass maps, shot maps, and heat maps come from Opta.
The video clips come from Wyscout and have been clipped from full games or downloaded as clips from the platform. Again, all these are from Eredivisie games in the 2021/2022 season.
All the data and video have been accurate and up to date, collected on April 26th, 2022.
Position and roles
Orkun Kökçü is a midfielder, but in that capacity has played in diferent positions this season. While he can be classified as a central midfielder, he has played the majority of his minutes in the Eredivisie this season, as a defensive midfielder.
Now, he is not a typical defensive midfielder, but here we have the debate between positions and roles. As position, he played as a defensive midfielder in a double pivot as employed by Arne Slot. Feyenoord usually plays in a 4–2–3–1 formation with Kökçü in that double pivot role.
If we look into his role rather than his position, we see the importance of him dictating play with his passes and progressing the ball from deep — allowing the attacking midfield trio to move up on the pitch. Therefore we can characterise him more as an 8 than a 6 on the pitch at Feyenoord.
Off the ball movement and positioning

In the image above you can see where Kökçü does his events during the games in the Eredivisie this season. While he plays in the double pivot, he is often seen in the left half space on the opposition’s half. Trying to penetrate the final third with his key passing, which we will see in the next section of this analysis.
In this role of his, he is responsible for progressing the ball further into the middle third and allowing others to become more advanced in either the wide areas or central areas. He is a player who opens up opportunities for the attacking players.
Key passing

In the image above you can see how well Kökçü is doing in the key passes per 90 and through passes per 90 metrics. He is doing well in both these metrics, as he scores above average with 0,58 key passes per 90 and 1,52 through passes per 90.
Key passing is of vital importance for a player like Kökçü as he is seen as the one that dictates play with his passing. He drops down from the midfield and poses as an instrument to connect the defence to the attack. His progression via key passing is instrumental as we will see in the next section, but his contribution to the attacking play is something he is considered for too.
In the graph below you can see how well he performs in the key passing metrics, compared to his peers on that position.

To illustrate his ability, I’ve taken three specific clips to showcase how he contributes to the attacking contribution via through passes.
In the video above you see a clip from Feyenoord vs FC Utrecht with Kökçü on the left. He receives the ball and spots a runner in the middle, making a movent to the left. His vision is the most important in this case, as he sees a run that most didn’t anticipate.
In the video above you see Feyenoord in their away match against Heracles Almelo, as Kökçü situates himself on the right side. He is in the box and makes himself available for the combination with the winger and as he gets it, he immediately passes it into the space which is vacant. By doing that the winger can invert and get ready for the cross.
In the video above you can see Feyenoord in their game against Willem II. Kökçü has proven to see where the space is for his teammates and in this example, that’s no different. The ability to find himself pressed but still pick out a through pass to an unmarked teammate, is something that makes him stand out.
Progression
We have seen above how well he does with progressing on the pitch via his passing, but how well does he with the ball on his feet? You can see that in the scatterplot below.

In the scatterplot above you see the metrics or progressive runs per 90 and dribbles per 90 combined. These metrics illustrate how well a player is doing on the progression of the ball on his feet, in contrast to the progression via passing.
Kökçü does above average in this metric as you can see, but isn’t exceptional. He has 2,27 progressive runs per 90 and 3,39 dribbles per 90. In the two clips below, I will show you how his dribbling looks like on the pitch.
In the video above you see Feyenoord in their game against FC Utrecht where Kökçü gets the ball on the left. It’s a combination that occurs often. He cuts inside and then moves outwards. At the moment he does that, a defender will step out and create space on the far end of the pitch – after which Kökçü will spot the runner.
In the video above you can see Feyenoord in their match against Willem II. Kökçü gets the ball in zone 14 and dribbles past his direct opponent, setting himself up for a shot. His attempt isn’t successful but it shows what he can do to get himself in a good position.
Expected threat

In the image above I have illustrated how well Kökçü does in the expected threat (xT) metric in this season’s Eredivisie. Before I look further into this, this is what xT is:
The basic idea behind xT is to divide the pitch into a grid, with each cell assigned a probability of an action initiated there to result in a goal in the next N actions. This approach allows us to value not only parts of the pitch from which scoring directly is more likely, but also those from which an assist is most likely to happen. Actions that move the ball, such as passes and dribbles (also referred to as ball carries), can then be valued based solely on their start and end points, by taking the difference in xT between the start and end cell. In the case of Grealish, his ball carry brought a 0.013 xT increase, and the pass added a further 0.26 xT. In short, he moved the ball from a low-xT cell (0.02 xT) to a much more dangerous area of the pitch (0.32 xT). Note that the xT action value can be negative for passes and carries that move the ball away from goal. – Soccerments
In short, how much does Kökçü contribute to the expected threat of a sequence of actions towards goal? If we look at the top 10 players of this season we see that Kökçü scores 3rd.
Shooting
In this part of the analysis, we will look at the quality of the shooting by Kökçü. In the scatterplot below you can see his expected goals per 90.

In the volume of shots, we can see that Kökçü does above average. He has 2,44 shots per 90. In the expected goals generated from those shots, the Feyenoord midfielder performs above average as well with 0,18 xG per 90. But it has to be said that he isn’t the most prolific striker of the ball in terms of generating xG.
Obviously, this tells us how he converts his shots into xG, but where does he take his shots? This will give us a more clear idea of why his xG is generated the way it is.

In the shot map above you can see where Kökçü takes his shots. He has 72 shots in the season so far, generating a total xG of 5,35. The actual goals he has scored have been 7, including 2 penalties. This means that he is overperforming his xG slightly by +1,65. This means that the likelihood of scoring is lower than his actual goal tally in the 2021/2022 Eredivisie season.
In the video below you can see all his goals in the Eredivisie so far:
Assists

In the scatterplot above you see the metrics expected assists and assists per 90 combined. This shows us how many assists Kökçü is expected to give per 90 minutes and the actual assists he gives per 90. In this aspect of his end product, he does very well. He has 0,26 xA per 90 minutes and gives 0,2 assists per 90. This means he is slightly underperforming with -0.06 per 90.
In total, he is expected to give 7,65 assists in this Eredivisie season and because he assisted 6, he is underperforming with -1,65. A notion of his assisting numbers is that he is the one for the set pieces, and therefore generates a higher xA than from open play.
Here are all his assists from the season so far:
Final thoughts
Orkun Kökçü is a talented player who is ready for the next step. He can definitely play in either the Bundesliga, La Liga, Serie A, Premier League or Ligue 1 – but he is suitable for some roles better than others. While he is used as an 8 in the double pivot, his data suggests that he is very good in the creating from the half space and zone 14, with his assists numbers being very good as well as his contribution to the expected threat.
As a central midfielder with an attacking mind, he could definitely contribute a lot as he likes to dictate play in the beginning of the attack, but also his danger in the attacking third. His attacking vision and awareness of runners is good, but his defensive contribution can be described as slow. For a box-to-box midfielder, he has a great work ethic and vision – also on the defensive side. But his pace between transitions is something he could work on, as well as choosing the moments where he takes a shot.
CRYSTAL PALACE AND THE ART OF THE LONG BALL
I have always been fascinated by the use of a long ball. In terms of using a long ball, it’s often regarded as a negative thing to do – or at least it has been for a long time. Now we have started to look a bit differently at the game in terms of attack and defence, which leads us to the fact that a defensive style of play isn’t negative football. It’s all about which principles you adhere to.
In this particular case study, I wanted to look at Crystal Palace. The reason for that is because, in the Premier League, Crystal Palace has the second number of long balls per 90 minutes.

As you can see in the image above, Crystal Palace has many long passes per 90 minutes – but are surrounded by teams who are battling against relegation. Solely based on this, the question remains: do Crystal Palace play conservative football and are they under pressure a lot, to maintain the long ball?
Obviously, the question above is generalised and not based on any evidence, but the interesting point still holds ground. What do Crystal Palace do in their game, that they maintain the long ball so much? To answer that in part, I’m analysing the long balls by the four players with the most long balls in the Crystal Palace’s squad:
- Tyrick Mitchell
- Marc Guehi
- Joachim Andersen
These players are all defenders which makes it an interesting case, but we shouldn’t be biased or prejudiced. Defenders are more than just people who defend, they are players who construct attacks and lead the defensive organsiation. In that light, I have made the distinction between long balls that:
a) Strengthen the defensive organisation
b) Construct attacks
The analysis will be done by looking at a few examples of every player. The footage comes from Wyscout and has been taken from the platform prior to April 9th, 2022. Any results after that haven’t been included in this analysis.
Strengthening the defensive organisation
One use of the long ball can be to reorganise the defensive shape of the team. When a team is under the pressure from the opposition, this can lead to hazardous situations. One can be that the central defenders and or full backs are being pressed aggressively and their only way out is to play a long ball and regain their defensive solid positioning.
Another way is when there has been a counter-attack from the opposition and in order to regroup and make sure the rest defence is aided, is to clear the ball long and give the other players time to drop deep again.
In the three examples below we look at the three players in the defence of Crystal Palace, making sure the team has room, space and time to reorganise their defensive shape.
In the video above we see Tyrick Mitchell in the FA Cup game against Everton. Everton has the ball in the defensive third of Crystal Palace and are looking threatening to the defence. The ball comes to Mitchell’s feet who just gives the ball long into the high middle third. In doing so the accent of play goes to that area, the attackers drop deep and therefore the defence can reorganise. They go the most optimal position and move up the pitch, to maintain a higher line – as Crystal Palace is looking to be more attacking in this phase.
In the video above, you see Crystal Palace in their Premier League game against Arsenal. Marc Guehi is very comfortable at the ball – which we will touch upon in the attacking side of the long balls – and this can also be seen in this particular example. Whilst he has enough time to do something with the ball, he’s fully aware of the press Arsenal employs on him and chooses to go long in order to give the defence a breather.
Pressing isn’t only about the man who is on the ball, but also about the pressing that occurs in the passing lanes or passing options. In that regard, playing the ball long offers more stability in the back.
In the video above, we see Crystal Palace against Arsenal. While we have seen that Mitchell and Guehi have different ways of restoring defensive shape, Andersen is the most defensive-minded and less concerned with taking time.
He gets the ball in a tighter space from his teammate and has little time to think, as Lacazette presses him aggressively on that right side. He opts to shoot the ball long and high, giving him and his defensive teammates as much time to regroup. In doing so, it’s all about time and not about progression. And that’s the difference between Mitchell and Guehi. They opt to play the ball long but also use the time to maintain a higher position on the field.
Constructing attacks

In the image above you see two long balls often played by Crystal Palace: the ball across the wide areas by the full back to an attacker who moves wide. Or, the ball goes from one central defender to the wide-area with the attacker making that same movement. Other variables than portrayed, are of course also known to happen.
Constructing attacks from ball-playing defenders happens a lot with Crystal Palace. Full backs do make runs down the line, but the direct ability to play a long ball and instantly set up the danger in the attacking third, is where Crystal Palace has had success as well.
In the video above we see Crystal Palace in their game against Arsenal. Mitchell has the ball and is not pressed, which gives him the time to look for the run of a teammate. Crystal Palace want to utilise the wide areas and that’s the attackers make a movement.
In this case, Mitchell provides a ball to the left which is received by Crystal Palace and immediately goes into the attacking shape. While Arsenal defends the ball well, it’s this kind of playing long balls that can see Crystal Palace become dangerous within seconds.
In the video above, we see another video of the game Crystal Palace vs Arsenal. What Guehi excels in, is his ability to spot an attacking player, recognise the run that the attacker does and pinpoint the pass in that direction. That’s what he does here as well.
He has time on the ball, moves to his right foot and spots the run Zaha is making. His pass is into an area where Zaha has to go to as well, which makes the pass dynamic and keeps the attack alive if Zaha receives the ball well. He does and in doing so, the ball has just gone from defensive third to attacking third with one pass. A direct passing style of play caused Arsenal all sorts of problems.
Final thoughts
Football can be played in many ways. There is no right or wrong way to play football, but it’s important to illustrate that long passes can have different uses. While most people have claimed in the past that they are part of the defensive part of play, it’s important to stress that long passes or long balls are a sign of something else: the direct passing style of play.
Crystal Palace want to attack through their direct passing and choose to have as few passes as possible to get in that final third. This can be achieved through their long balls from the back by either the central defensive duo or the full back pairing.
In defence, it’s really important as well. Playing out from the back might be more aesthetically pleasing, but in professional football, it’s all about being effective. Playing the ball long can lead to satisfying attacking results, but it also gives the defence time, space and room to reorganise their defence and strengthen it.