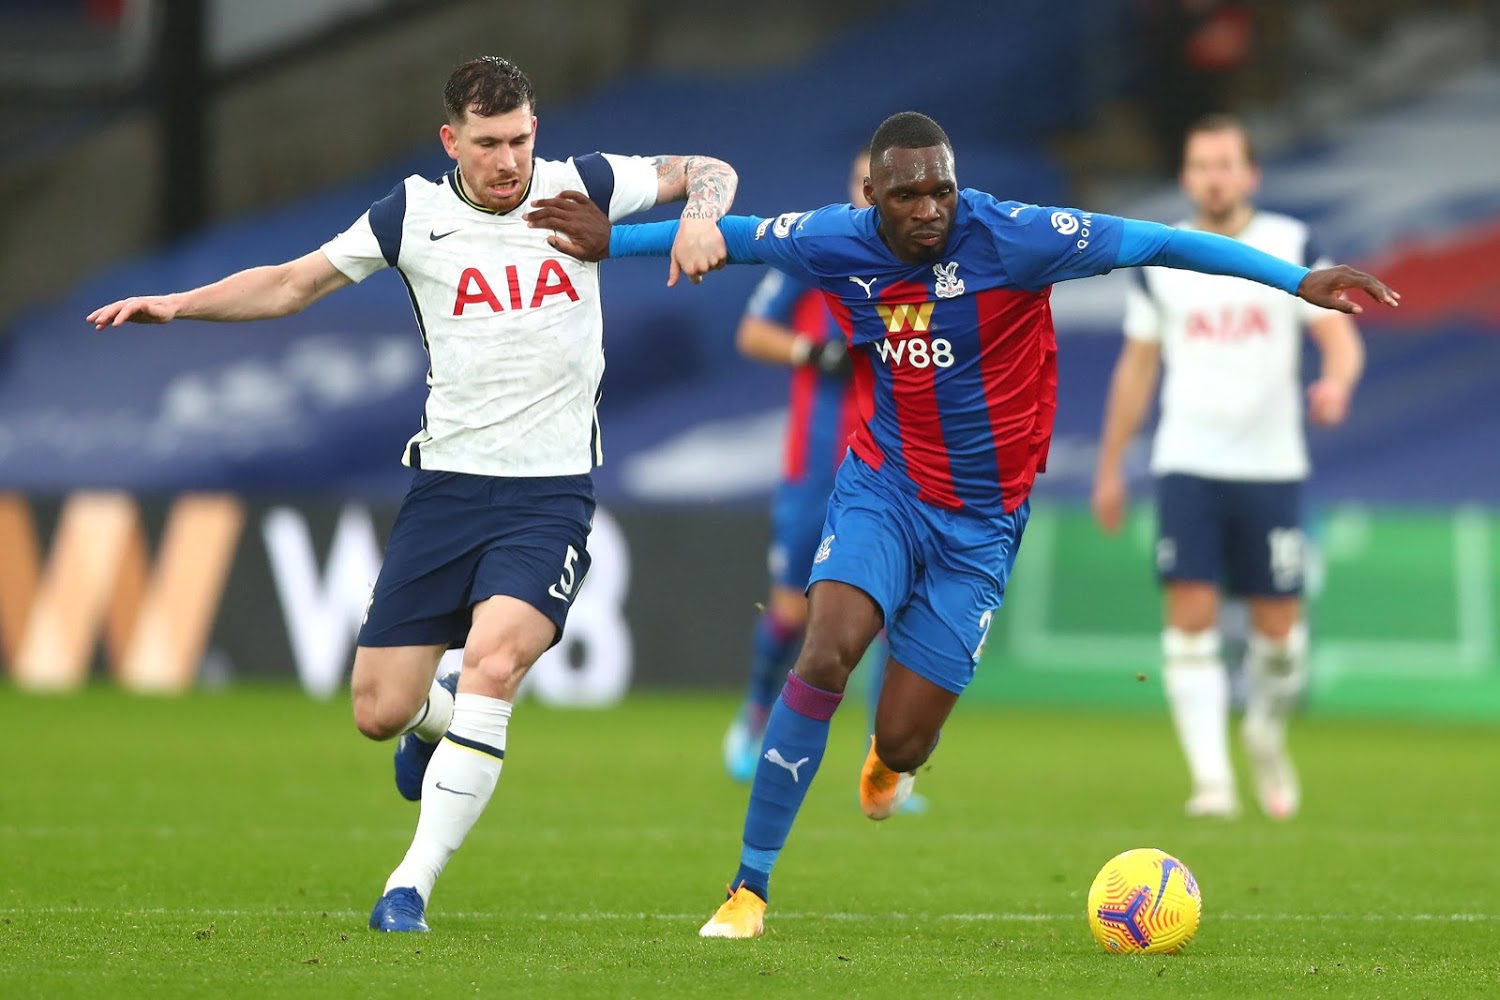
I used to go up to KRC Genk a lot. It’s just a one hour drive from where I live and I have some great footballers and icons. Thomas Buffel. Jelle Vossen. Kevin de Bruyne. Thibaut Courtois. But the one that always stood by me, was Christian Benteke. I’ve always been fascinated by him and his career, so this is an excellent opportunity for me to write about him and his xG performances in the 2020/2021 season.
Benteke signed a two year contract extension just before Euro 2020 started, which will keep him a Palace player until the end of June 2023. He scored 10 goals in 30 league appearances, with a very strong finish – just before contract negotiations entered their final stages.
I want to see if there’s a relation between the end of the contract and the expected goals performance of a striker. Whether he is more motivated to show his skills in the light of a contract extension or attracting new clubs who he can sign for. Now, this is difficult to fully assess, because you cannot look in the mind of the player – but I will nonetheless try to attempt to look at his performances. I will look at the data from 2020/2021 with the difference between the first and second half of the season.
Data The data has been retrieved from Wyscout and Instat at June 20th 2021. The players that are compared to Benteke, have played over 900 minutes and therefore the database consists of 65 players.
xG performance in 2020/2021
So, how well does Benteke do compared to his peers? In this scatterplot below we look at the shots per 90 vs the expected goals per 90 – because we want to look at the chances and how big the chances were. This gives an idea of the probability of scoring and whether Benteke is a top performer in the 2020/2021 Premier League season.
As you can see in the scatterplot above, Benteke still is really present in both shots per 90 and xG per 90 in the Premier League. He has 3,09 shots per 90 in this season with only Salah, Kane and Jota shooting more per 90 minutes than the Belgium. When we look at xG per 90, Benteke has 0,54 xG per 90 minutes. Only Vardy, Salah, Bamford, Antonio, Kane and Jota have a higher xG per 90 minutes than Benteke.
As we can see Benteke is one of the best performers in the metrics we analysed above, but how well does he do overall per game this season? To see if he actually had a better xG per game in the latter stages of the season, we need to look at what he performed per game. In the graph below you see the xG per matchday. Important is that these matchdays are all of Benteke’s matchdays and not the official matchdays of the Premier League.
We can see a few interesting things about Benteke’s xG performance in this season. We see that he had a difficult start with four games without xG, but they were also games where he didn’t play many minutes. He has two big xG games, before gradually going down in matchday 14, 19 and 23. Before matchday 24 he fails to grow his xG, but from matchday 24 – he is on the rise again, resulting in the highest xG of the season in matchday 28. This tells us that he finished really strongly, but there are a few questions that arise.
What kind of chances were there in those games? Did he take many chances that were lower xG or just a few high xG chances? In the graph below you can see the volume of shots in every game and the corresponding xG that comes with it.
So, when look at this particular graph we don’t see any big differences from the xG graph – but another thing that is worth looking at is the volume of shots released. The change in consistency of shots taken from matchday 24 is an upgrade from before and in these last 6 games he has had 3 shots or more in each of those games. With consistently shooting, Benteke also upped his xG in these final games of the season.
Shotmaps
Above you can see the shot map of Benteke in this current season with the size of the dots representing the size of the expected goals. This gives an idea of the total shots per season, and from where he attempted his shots. The goals are indicated in red, the shots are indicated in grey. In general, the closer you get to the goal, the higher the xG is.
In the shotmap below you can see the shotmap of the last six games and see whether his xG comes from volume or that it comes from high quality chances that are taken.
What we can conclude from the shot map above is that Benteke has tried to shoot a lot from inside the penalty area. He had 22 shots of which 4 were goals with an xG of of 5,22. So if anything, he was slightly underperforming his xG – but he was getting in the right positions to make more goals.
All this has to do with the way Crystal Palace plays, the momentum they have, how well Benteke’s team mates are doing and the opposition, but the fact remains that the expected goals in the last six game have significantly become higher.
Final thoughts It’s difficult to draw a conclusion from the data illustrated above and the thought of contract negotiations. But we can see a few things. First of all we can see that the xG number has become bigger to the end of the season. Earlier in the season there were big numbers, but also quite low points. In the end of the season this isn’t the case anymore.
Secondly, the volume of shots has not only risen, but has been quite consistent. Consistently shooting more than three times per 90 minutes in the final six games of the season, has definitely added to the xG. Added to that is that four of the ten goals scored by Benteke, have come in that final six games of the season – where he also made sure that he was in the penalty area a lot.
Again, it’s difficult to draw a line and say that his intention of playing direct, more efficiently has a direct correlation with a new contract, but it would be a very big coincidence if the increase in xG would just happen at the end of the season.
This is the 22nd day of consecutive writing and the 25th article that will be published. I don’t want to flex or anything, but I thought this asked for a rather different kind of article than I have written before. In this article I will look to combine something unmeasarable as confidence with opportunity.
Whenever a player scores a screamer from 30 meters it does something with a player in that match. He or she will feel more confident in attempting high-risk shots, passes or other actions. That’s definitely something that can be seen in that particular game. But this analysis does concentrate on something different. What does this mean in the long run, will the player attempt more of those shots after scoring that screamer?
In this analysis I will look to analyse this by looking at three players from Red Bull Salzburg in the Austrian 1. Bundesliga. I will analyse how many shots they have attempted in the season so far, how many goals have been scored from those opportunities and make a distinction which goals/attempts have been made from zone 14.
After doing this I will select a goal from each of the three players and see whether they have attempted more low xG shots than high xG shots, and whether they have tried to shoot more from zone 14, than before. I have chosen three players who scored the most goal for Red Bull Salzburg: Daka, Kiota and Berisha.
The data and video come from Wyscout and are from the 2020-2021 season.
Data analysis Before we go to the actual analysis of that what has been explained above, we are going to look at where the RB Salzburg players are in terms of shots, xG and goals in relation to the league and to to number two Rapid Wien. The dataframe consists of central forwards in the 2020-2021 Austrian Bundesliga season with a minimum of 800 minutes played in the league.
In the scatterplot above we see two metrics combined. On the X-axis we have the shots per 90 metrics to assess how many shots a player has per 90 minutes. And on the Y-axis we have the shots on target in %, to assess how much percentage of the shots taken will go on target. The dots in red represent players from Red Bull Salzburg.
When we look at the shots taken per 90 minutes we see that Okafor has 1,9 shots per 90, Adeyemi has 2,39shots per 90, Berisha has 3,39 shots per 90, Daka has 4,27 shots per 90 and Koita has 4,94 shots per 90.
When we look at the percentages of shots that go on target we see that Adeyemi has 42,31% on target, Daka has 51,14% on target, Berisha has 52,17% on target, Okofar has 58,82% on target and Koita 59,18% on target.
In the scatterplot above we can see the metrics of expected goals per 90 and goals per 90 combined. It tells us the probablity of a goal scored per 90 minutes and the the actual goals scored per 90 minutes. The Red Bull Salzburg players are represented via the red dots.
When we look at the expected goals per 90 minutes we see that Okafor has 0,27 xG per 90, Adeyemi has 0,35 xG per 90, Berisha has 0,68 xG per 90, Daka has 0,99 xG per 90 and Koita has 1,18 shots per 90.
When we look at the goals per 90 minutes we see that Okafor has 0,56 goals per 90, Adeyemi has 0,46goals per 90, Berisha has 0,54 goals per 90, Daka has 1,17 goals per 90 and Koita has 1,41 goals per 90.
The three players we are looking at for this analysis are Berisha, Daka and Koita. Daka has scored 24 goals with an xG of 20,3. Berisha has scored 11 goals with an xG of 13,82, and Koita has scored 14 goals with an xG of 11,67. In the scatterplots above you see how well they are performing against the strikers of Rapid Wien.
Zone 14 You probably have heard of zone 14 – even if you don’t exactly know what it is. Zone 14 is used a lot to develop and analyse attacking creativity in terms of decisive attacking options.
Credit: Spielverlagerung
In the image above you see a football pitch divided in a 6×3 grid. The zone in red is zone 14 and it’s the zone that starts from the lines of the six-yard box, but is outside the penalty area. From this area there is a high success from creating goalscoring opportunities, as a lot of assists come from that particular area.
I’m not looking at assists in this analysis, but at shots. Often, the zone 14 becomes a good zone to shoot from as the opposition makes sure to overload the penalty area. This is especially the case when the team in possession of the ball is quite dominant in their way of playing and the defending side needs to be compacted in the defensive third.
So, strikers and attacking midfielders try to shoot from this particular area because the pressing or overloads are not as present as in the penalty area. The expected goals from this particular zone is lower and therefore these goals are less frequent, but do show great ability of the attacking player.
Expected goals by players
Player
xG low (0-0,4)
xG middle (0,4-0,6)
xG High (0,6-1)
Daka
44
2
4
Berisha
58
4
4
Koita
44
2
4
In the table above you see the different xG types in the games played by Red Bull Salzburg. They all take a big number of low xG shots and all have the same number of high xG shots, but that has mostly to do with them tacking penalties as well. Only Berisha has slight more middle xG shots, which is interesting as we move forward.
Daka – shot locations
Daka has taken 88 shots in all games in the 2020-2021 Austrian Bundesliga season. 24 of those shots resulted in a goal for Daka, which is a conversion rate of 27,27%. In the image below you can see the locations of all the shots by Daka.
In the image above we see all 88 shots taken bij Daka in this season so far. The grey dots stand for the shots taken that and the red dots indicate the goals scored in this season. If we look at shots placed in the zone 14, we see 9 shots that have been taken in that particular zone and we now want to find out what made him shoot more from distance.
Daka’s qualities lie within the penalty area and as you can see, all of his goals have been scored from that. However, he does attempt to shoot more from distance, as you can see by the grey dots outside the penalty area and we can see a trend. After he scores 3 goals from 3 shots in his games against Hartberg, Ried and Altach (within his first 15 shots of the season) – he seems to grow more confident in his abilities and attempts to shoot more from distance. Before those three goals, he attempted one shot outside the penalty box. After those three goals, he attempted six shots in 30 from zone 14.
Match
Date
Minutes played
Goals
Shots / on target
xG
Sturm Graz – Salzburg 1:3
2021-05-09
66
0
4
3
0,82
Salzburg – Wolfsberger AC 1:1
2021-04-28
49
0
2
0
0,8
Wolfsberger AC – Salzburg 1:2
2021-04-25
82
1
7
4
1,74
WSG Swarovski Tirol – Salzburg 3:2
2021-04-21
49
0
3
0
0,96
Salzburg – LASK Linz 2:0
2021-04-18
90
0
2
0
0,18
Rapid Wien – Salzburg 0:3
2021-04-11
102
0
3
1
0,47
Salzburg – Sturm Graz 3:1
2021-04-04
95
3
5
4
1,86
LASK Linz – Salzburg 0:1
2021-03-20
94
1
2
1
0,3
Salzburg – Admira 3:1
2021-03-13
94
1
2
2
0,2
Salzburg – St. Pölten 4:1
2021-03-07
78
1
3
2
0,44
Sturm Graz – Salzburg 2:1
2021-02-28
61
1
1
1
0,76
Salzburg – Rapid Wien 4:2
2021-02-21
73
3
8
5
1,92
WSG Swarovski Tirol – Salzburg 2:4
2021-02-13
96
2
5
2
0,72
Salzburg – Austria Wien 3:1
2021-02-10
35
0
1
0
0,01
Hartberg – Salzburg 0:3
2021-01-30
88
1
2
1
0,33
Salzburg – Ried 3:0
2021-01-27
64
1
4
1
0,97
Rheindorf Altach – Salzburg 0:2
2021-01-24
82
1
3
1
0,35
Salzburg – Wolfsberger AC 2:3
2020-12-20
95
1
9
3
1,28
Salzburg – LASK Linz 3:1
2020-12-13
71
1
3
3
0,54
Admira – Salzburg 1:0
2020-12-05
62
0
2
1
0,26
Austria Wien – Salzburg 0:2
2020-10-24
32
1
1
1
0,72
Salzburg – Hartberg 7:1
2020-10-04
94
2
4
3
1,18
Ried – Salzburg 1:3
2020-09-26
34
1
1
1
0,33
Salzburg – Rheindorf Altach 4:1
2020-09-19
74
1
6
3
1,61
Wolfsberger AC – Salzburg 1:3
2020-09-13
94
1
5
2
1,55
The three goals he scored at the beginning of the season had a quite high xG: 0,88 vs Hartberg, 0,22 vs Ried, and 0,76 vs Altach. Obviously, this gave him a confidence boost in scoring goals, but not so much in shot locations (if we look at xG), because the shots in zone 14 had xG scores between 0,01 xG and 0,07 xG. The scored goals don’t indicate confidence in trying low xG shots from zone 14. After those three goals, he had 7 more xG shots that were higher than 0,6xG (with two penalties) – but they all were in the six-yard box, bar the two penalties.
What’s interesting is that he keeps scoring goals, but after 40 shots, he only attempts one shot in zone 14 in 48 shots. We cannot really see this in the data whether his confidence will grow or slink, but he continues to shoot more from the penalty area and in the six-yard box.
Berisha – Shot locations Berisha has taken 69 shots in all games in the 2020-2021 Austrian Bundesliga season. 11 of those shots resulted in a goal for Berisha, which is a conversion rate of 15,94%. In the image below you can see the locations of all the shots by Berisha.
In the image above we see all 69 shots taken by Berisha in this season so far. The grey dots stand for the shots taken that and the red dots indicate the goals scored in this season. If we look at shots placed in zone 14, we see 5 shots that have been taken in that particular zone and we now want to find out what made him shoot more from distance.
Berisha’s qualities lie within the penalty area and as you can see, all of his goals, bar one, have been scored from that. However, he does attempt to shoot more from distance, as you can see by the grey dots outside the penalty area and we can see a trend. In the first 20 shots Berisha had in the season he managed to score 7 goals, which is more than half of his total of 11. One of these goals comes from outside the penalty. This gives him the freedom and confidence to shoot a lot, and he wants to replicate that. We see that in the rest of the 48 shots where he shoots 5 times from zone 14.
Match
Date
Minutes played
Goals
Shots / on target
xG
Sturm Graz – Salzburg 1:3
2021-05-09
79
0
3
0
0,15
Salzburg – Wolfsberger AC 1:1
2021-04-28
60
0
1
0
0,25
Wolfsberger AC – Salzburg 1:2
2021-04-25
74
1
5
4
0,94
WSG Swarovski Tirol – Salzburg 3:2
2021-04-21
47
0
4
3
1,71
Salzburg – LASK Linz 2:0
2021-04-18
95
1
5
2
1,21
Rapid Wien – Salzburg 0:3
2021-04-11
80
0
1
1
0,03
Salzburg – Sturm Graz 3:1
2021-04-04
92
0
3
2
0,36
LASK Linz – Salzburg 0:1
2021-03-20
74
0
3
1
0,8
Salzburg – St. Pölten 4:1
2021-03-07
94
1
5
2
1,17
Sturm Graz – Salzburg 2:1
2021-02-28
98
0
3
0
0,29
Salzburg – Rapid Wien 4:2
2021-02-21
94
0
3
2
0,33
WSG Swarovski Tirol – Salzburg 2:4
2021-02-13
96
1
5
2
1,36
Salzburg – Austria Wien 3:1
2021-02-10
73
0
4
2
1,23
Salzburg – Ried 3:0
2021-01-27
30
0
2
1
0,1
Rheindorf Altach – Salzburg 0:2
2021-01-24
72
0
1
1
0,17
Salzburg – Wolfsberger AC 2:3
2020-12-20
95
1
5
3
1,5
Salzburg – LASK Linz 3:1
2020-12-13
71
1
3
1
0,39
Admira – Salzburg 1:0
2020-12-05
25
0
1
0
0,01
St. Pölten – Salzburg 2:8
2020-11-28
59
1
2
2
0,57
Salzburg – Sturm Graz 1:3
2020-11-21
96
1
2
1
0,19
Rapid Wien – Salzburg 1:1
2020-11-08
97
0
2
2
0,33
Austria Wien – Salzburg 0:2
2020-10-24
64
1
3
2
0,33
Ried – Salzburg 1:3
2020-09-26
75
2
3
2
0,4
Salzburg – Rheindorf Altach 4:1
2020-09-19
32
0
0
0
0
Wolfsberger AC – Salzburg 1:3
2020-09-13
61
0
0
0
0
The goal that gave him the confidence to shoot from outside the penalty area was against Sturm Graz and has an xG of 0,02. Obviously, this gave him a confidence boost in scoring goals, and he was looking to replicate it from those locations in zone 14. He had 5 more shots from zone 14 and they had a similar xG to the goal: between 0,02 xG and 0,04 xG. However, after trying a lot to score from low xG positions (outside the penalty area + on edge penalty area) he didn’t score after 25 shots and started shooting more again from positions with a higher xG per shot.
Koita – shot locations
Koita has taken 49 shots in all games in the 2020-2021 Austrian Bundesliga season. 14 of those shots resulted in a goal for Koita, which is a conversion rate of 28,57%. In the image below you can see the locations of all the shots by Koita.
In the image above we see all 49 shots taken by Koita in this season so far. The grey dots stand for the shots taken that and the red dots indicate the goals scored in this season. If we look at shots placed in zone 14, we see 4 shots that have been taken in that particular zone and we now want to find out what made him shoot more from distance.
Koita’s qualities lie within the penalty area and as you can see, all of his goals, have been scored from that. However, he does attempt to shoot from distance, as you can see by the grey dots outside the penalty area and we can see a trend. What’s particularly interesting about this is that the shots from zone 14 only appear after 40 shots taken in the league and don’t have any significance to a goal from distance, as the chances Koita has are all from a higher xG.
Match
Date
Minutes played
Goals
Shots / on target
xG
WSG Swarovski Tirol – Salzburg 2:4
2021-02-13
37
1
2
1
0,89
Salzburg – Austria Wien 3:1
2021-02-10
84
1
5
2
1,09
Hartberg – Salzburg 0:3
2021-01-30
72
1
2
1
0,95
Salzburg – Ried 3:0
2021-01-27
94
1
2
2
0,32
Rheindorf Altach – Salzburg 0:2
2021-01-24
23
0
1
0
0,04
Salzburg – LASK Linz 3:1
2020-12-13
24
0
2
2
0,12
Admira – Salzburg 1:0
2020-12-05
35
0
3
0
0,09
St. Pölten – Salzburg 2:8
2020-11-28
36
3
4
4
1,51
Salzburg – Sturm Graz 1:3
2020-11-21
40
0
1
1
0,32
Rapid Wien – Salzburg 1:1
2020-11-08
76
1
3
2
0,55
Salzburg – WSG Swarovski Tirol 5:0
2020-10-31
33
2
5
3
1,76
Austria Wien – Salzburg 0:2
2020-10-24
83
0
5
3
0,47
Salzburg – Hartberg 7:1
2020-10-04
94
2
4
4
0,97
Ried – Salzburg 1:3
2020-09-26
65
0
4
1
1,31
Salzburg – Rheindorf Altach 4:1
2020-09-19
64
1
3
2
0,89
Wolfsberger AC – Salzburg 1:3
2020-09-13
33
1
3
1
0,39
The goal on the edge of the box had an xG of 0,05. The three other shots attempted from zone 14 had xG between 0,02 and 0,03. So they somewhat resemble that goal on the edge of the penalty area/zone 14 – but they are not a direct consequence of that action.
Flaws in this analysis Going into this analysis I had an open mind of where it could lead – I thought. The things is that I wanted to explore how much the strikers gained confidence when scoring from zone 14, but there were a few flaws in my thinking. I didn’t consider the fact that Red Bull Salzburg play a style that doens’t involve a lot of striker shooting action in that particular zone, but more in the six-yard box.
A second thing I didn’t take into consideration was the fact that the position of strikers were not optimal for this type of analysis. If I would do this again, I would choose attacking midfielders or advanced central midfielders, as they are more natural in that particular area or zone.
The last thing I didn’t take into consideration – but a conscious decision – was the psychological factor. Confidence has everything to do with one’s perception of themselves. If a player fairs greatly with scoring, then this could be a huge factor within his play. Some players need that particular confidence to thrive. Others don’t need external factors to thrive and therefore are not affected as much as other players.
Conclusion There were some flaws in my analysis, but it was interesting to see the reaction of certain players in looking for similar xG shot locations. Daka seemed to be affected at first when he scored a few good goals, but they were not from a low xG location. His confidence to shoot from zone 14 grew because of his goals scored. Berisha attempted more from distance and was more present in zone 14. He tried to score more form zone 14 after he scored, but his production from this zone became less after 25 shots without any goal. Koita was not affected by the above, but a reason for this is that he didn’t score from zone 14 and that his most successful actions game from within the penalty area.
As said above, the physical event of scoring a low xG goal or a goal from zone 14 can influence the confidence of a player, but without looking at psychological factors, opposition and form – it’s hard to tell for 100%.
The Eredivisie 2020-2021 season is coming to a close. The champion has been known for quite some time now, but the battle for relegation and the European play-off spots are widely entertaining. And you should definitely look at the two last matchdays. Joy and heartbreak are close companions. How much I would love to chat about the emotions behind one of the most fun leagues in the world, this article will contain an analysis.
In this article, I will look at the formations used by every single club in the Eredivisie 2020-2021 season until matchday 33. I’m looking at matchday 1 till 32. In this analysis, I will look at the number of different formations used, which one is the most popular, and whether the formation changes when dealing with stronger/weaker opponents. In the last part, I will analyse whether these most-used formations can be seen as progressive or conservative.
One little disclaimer, this analysis is purely based on data from Wyscout and therefore doesn’t deal with certain roles. For example, a 4-4-2 can be with two strikers, but also with two false 9’s – this is not something I go into, I’m basing myself purely on the data. I have excluded the formations which are employed when receiving a red card, this and the fact that Wyscout doesn’t give all the percentages (when you add every it’s not 100%) – but I still wanted to go forward, to give an idea of the formations used.
Ajax Ajax are league leaders and crowned champions of this season. From the 32 games played this season, Ajax has won 26, drew 4 and lost 2 games. They have accumulated 82 points, scored 96 goals and conceded 21.
Formation
Percentage used
4-2-3-1
44%
4-3-3
33%
4-2-1-3
3%
4-1-4-1
3%
4-2-2-2
2%
4-4-2
1%
If we look at the table above we see that in 79% of the time, Ajax play in either a 4-2-3-1 formation with a double pivot and four attackers or with a more traditional 4-3-3 – which features one holding midfielder and two more advanced central midfielders/attacking midfielders. Ajax loves to play the majority of its games with wingers, as that utilises their philosophy the most.
PSV PSV currently are second, but that place has not been confirmed yet. From the 32 games played this season, PSV has won 20, drew 8, and lost 4 games. They have accumulated 68 points, scored 69 goals, and conceded 32.
Formation
Percentage used
4-4-2
61%
4-2-2-2
9%
4-3-3
9%
4-2-3-1
5%
4-5-1
2%
4-4-1-1
2%
4-3-1-2
1%
5-3-2
1%
4-1-3-2
1%
If we look at the table above we see that in 61% of the time, PSV play in a 4-4-2 formation and 9% of the time in a 4-2-2-2 formation. These two formations can be merged in percentages, as the 4-4-2 often represents itself as a 4-2-2-2 on the field, which together makes 70% of the games played in the Eredivisie. The 4-3-3 and 4-2-3-1 are used with 14% combined, but the favourite formation for PSV is with two strikers up top.
AZ AZ currenly are third, but still battling for place two. From the 32 games played this season, AZ has won 20, drew 7 and lost 5 games. They have accumulated 67 points, scored 70 goals and conceded 41.
Formation
Percentage used
4-2-3-1
60%
4-3-3
10%
4-4-2
6%
4-4-1-1
6%
3-4-3
2%
4-3-2-1
1%
4-3-1-2
1%
If we look at the table above we see that in 60% of the time, AZ play in a 4-2-3-1 formation and 10% of the time in a 4-3-3 formation. These are the most used formations by AZ and make up for 70% of the formations used in the Eredivisie this season. They love to play with wingers and a striker, which can be seen in those two formations. The 4-4-2 and 4-4-1-1 are used as well, but then AZ play with wide midfielders down the line.
Vitesse Vitesse currently are fourth, trying to secure that place. From the 32 games played this season, Vitesse has won 18, drew 6 and lost 8 games. They have accumulated 60 points, scored 48 goals and conceded 32.
Formation
Percentage used
3-4-1-2
43%
4-3-1-2
15%
3-5-2
14%
5-3-2
5%
3-4-3
2%
4-1-3-2
1%
If we look at the table above we see that in 43% of the time, Vitesse play in a 3-4-1-2 formation and 14% of the time in a 3-5-2 formation, and 2% of the time in a 3-4-3 formation. We can state that in 59% of the games, Vitesse loves to use a back-three. 5% of the games are played in 5-3-2, which means that only 16% of the games has been played with a back-four.
Feyenoord Feyenoord currently are fifth, and their objective is to reach fourth place, but that would prove to be incredibly hard. From the 32 games played this season, Feyenoord has won 15, drew 10, and lost 7 games. They have accumulated 55 points, scored 60 goals, and conceded 35.
Formation
Percentage used
4-3-3
33%
4-1-4-1
20%
4-2-3-1
16%
4-3-1-2
4%
5-4-1
2%
5-3-2
1%
3-5-1-1
1%
4-5-1
1%
4-4-2
1%
4-4-1-1
1%
If we look at the table above we see that in 33% of the time, Feyenoord play in a 4-3-3 formation and 20% of the time in a 4-1-4-1 formation, and 16% of the time in a 4-2-3-1 formation. We can state that in 69% of the games, Feyenoord plays with a back-four and occupies wingers/wide midfielders.
FC Utrecht FC Utrecht currently are sixth, and in theory could overtake Feyenoord if everything goes their way, but that would prove quite the challenge. From the 32 games played this season, Vitesse has won 13, drew 12, and lost 7 games. They have accumulated 51 points, scored 51 goals, and conceded 40.
Formation
Percentage used
4-2-3-1
56%
4-3-3
17%
4-4-2
10%
4-3-1-2
3%
4-4-1-1
3%
If we look at the table above we see that in 56% of the time, FC Utrecht play in a 4-2-3-1 formation. We can also see that FC Utrecht doesn’t deviate from their set formation, as the 4-2-3-1 formation, 4-3-3 formation, and the 4-4-2 formation – are 83% of the games.
FC Groningen FC Groningen is on their way back to compete for the European places and are currently seventh. From the 32 games played this season, FC Groningen has won 14, drew 7, and lost 11 games. They have accumulated 49 points, scored 40 goals, and conceded 36.
Formation
Percentage used
4-2-3-1
26%
5-3-2
10%
3-4-1-2
9%
3-4-2-1
9%
5-4-1
7%
4-4-2
5%
3-4-3
3%
3-5-2
3%
3-5-1-1
1%
4-1-3-2
1%
If we look at the table above we see that FC Groningen has played 10 different formations during the 2020-2021 season, with 25% of the games played with a back-three. This not-traditional approach is quite remarkable, but most games have been played under the 4-2-3-1.
Sparta Rotterdam Sparta Rotterdam currently are eight and are doing very well. Considered to battle against relegation they are up there to battle for the European play-off places. From the 32 games played this season, Sparta Rotterdam has won 13, drew 12, and lost 7 games. They have accumulated 43 points, scored 47 goals, and conceded 47.
Formation
Percentage used
4-4-2
30%
4-2-3-1
21%
4-4-1-1
16%
4-3-1-2
8%
5-3-2
7%
4-1-4-1
2%
3-4-1-2
2%
If we look at the table above we see that Sparta has played 7 different formations during the 2020-2021 season, with 77% of the games played with a back-four. The foundation is a back four with in most cases a midfield of at least four players.
Heracles Almelo Heracles Almelo are on the nineth place and are having an average season. Too good for relegation football, but not good enough to challenge a lot more. Still they are in the race for European football places. From the 32 games played this season, Heracles Almelo has won 13, drew 12, and lost 7 games. They have accumulated 43 points, scored 41 goals, and conceded 47.
Formation
Percentage used
4-4-2
24%
4-2-3-1
23%
4-4-1-1
14%
4-3-3
8%
5-3-2
7%
4-3-1-2
3%
4-3-2-1
2%
If we look at the table above we see that Heracles Almelo has played 7 different formations during the 2020-2021 season, with 74% of the games played with a back-four. The foundation is a back four with in most cases a midfield of at least four players. The majority has been played with a four-man midfield with a form of two strikers.
Fortuna Sittard Fortuna Sittard are on the tenth place and are having a good second half of the season after starting with some troubles. They are also in the conversation fror European football and that would be a huge achievement. From the 32 games played this season, Heracles Almelo has won 12, drew 14, and lost 16 games. They have accumulated 40 points, scored 46 goals, and conceded 53.
Formation
Percentage used
4-4-1-1
28%
4-2-3-1
20%
4-3-3
11%
4-4-2
10%
4-3-1-2
8%
4-1-4-1
7%
5-3-2
2%
3-4-1-2
2%
If we look at the table above we see that Fortuna Sittard has played 8 different formations during the 2020-2021 season, with 69% of the games played with a 4-4-11, a 4-2-3-1, a 4-3-3 or a 4-4-2 formation. The formations that haven’t been played with a back-four only make up for 4%.
SC Heerenveen SC Heerenveen are in eleventh place and are having a disappointing season. A club like Heerenveen should battle for European places, but at the moment they seem to miss out on that. From the 32 games played this season, SC Heerenveen has won 9, drew 12, and lost 11 games. They have accumulated 39 points, scored 41 goals, and conceded 44.
Formation
Percentage used
4-2-3-1
46%
4-4-2
19%
4-4-1-1
11%
5-4-1
8%
4-3-3
4%
4-3-1-2
2%
If we look at the table above we see that SC Heerenveen has played 6 different formations during the 2020-2021 season, with 76% of the games played with a 4-2-3-1, a 4-4-2 or a 4-4-1-1 formation. The formations that haven’t been played with a back-four only make up for 8%.
FC Twente FC Twente are in twelfth place and are having a season of mixed emotions. The former title winner is looking to restore its former glory, but is also just a few years back in the Eredivisie. From the 32 games played this season, FC Twente has won 9, drew 11, and lost 12 games. They have accumulated 38 points, scored 44 goals, and conceded 46.
Formation
Percentage used
4-2-3-1
45%
4-3-3
37%
4-1-4-1
10%
If we look at the table above we see that FC Twente has only played 3 different formations during the 2020-2021 season, with variations that resemble the same sort of formation: 4-2-3-1, 4-3-3 and 4-1-4-1.
PEC Zwolle PEC Zwolle are in thirteenth place and are done. They haven’t had any form of outstanding performances this season, but are safe from relegation. From the 32 games played this season, PEC Zwolle has won 8, drew 11, and lost 13 games. They have accumulated 35 points, scored 41 goals, and conceded 49.
Formation
Percentage used
4-3-3
63%
4-2-3-1
13
4-1-4-1
10
If we look at the table above we see that PEC Zwolle has only played 3 different – just like FC Twente – formations during the 2020-2021 season, with variations that resemble the same sort of formation: 4-3-3, 4-2-3-1 and 4-1-4-1.
RKC Waalwijk RKC Waalwijk are in fourteenth place and are anything but done. They are in the best position to escape direct relegation or relegation play-offs, but are still not there yet. From the 32 games played this season, RKC Waalwijk has won 6, drew 9, and lost 17 games. They have accumulated 27 points, scored 35 goals, and conceded 51.
Formation
Percentage used
4-2-3-1
63%
4-4-1-1
8%
4-1-4-1
7%
4-3-3
4%
4-3-2-1
3%
4-4-2
1%
If we look at the table above we see that RKC Waalwijk has played 6 different formations during the 2020-2021 season, with all games playing a formation with a back-four with a strong preference for the 4-2-3-1 formation.
Willem II After RKC Waalwijk, Willem II are the most fortunate to get out of the relegation troubles, in fiftheenth place. But it’s tight. From the 32 games played this season, Willem II has won 6, drew 7, and lost 19 games. They have accumulated 25 points, scored 34 goals, and conceded 66.
Formation
Percentage used
4-2-3-1
56%
4-4-2
18%
4-4-1-1
5%
4-3-3
3%
5-4-1
2%
4-1-4-1
2%
If we look at the table above we see that Willem II has played 6 different formations during the 2020-2021 season, with all games playing a formation with a back-four with a strong preference for the 4-2-3-1 formation. The only formation that hasn’t got a back-four is the 5-4-1 formation.
FC Emmen FC Emmen looked dead and burried, but are still in the race to stay up, in sixteenth place. But everything comes down to these last two games. Right now they stand on the place for the relegation play-offs. From the 32 games played this season, FC Emmen has won 5, drew 9, and lost 18 games. They have accumulated 24 points, scored 33 goals, and conceded 67.
Formation
Percentage used
4-2-3-1
57%
4-4-2
15%
4-1-4-1
4%
4-4-1-1
2%
4-3-3
1%
4-5-1
1%
If we look at the table above we see that FC Emmen has played 6 different formations during the 2020-2021 season, with all games playing a formation with a back-four with a strong preference for the 4-2-3-1 formation and the 4-4-2 formation.
VVV-Venlo VVV-Venlo had a very good position to stay up in January but has to do everything they can do not get relegated directly, in seventeenth place. From the 32 games played this season, VVV-Venlo has won 6, drew 5, and lost 21 games. They have accumulated 23 points, scored 42 goals, and conceded 84.
Formation
Percentage used
4-1-4-1
22%
4-2-3-1
17%
4-4-2
16%
4-3-3
13%
4-3-1-2
6%
4-4-1-1
5%
3-4-2-1
3%
3-4-1-2
2%
4-1-3-2
1%
If we look at the table above we see that VVV-Venlo has played 9 different formations during the 2020-2021 season, with four formations being used a lot: 4-1-4-1 formation, 4-2-3-1 formation, 4-4-2 formation and the 4-3-3 formation. There have been two formations with a back-three, but they make up only 5% of the used formations in games.
ADO Den Haag ADO Den Haag really looked they were finished, but in the last two games they had back to back victories, and still have a chance to stay up. From the 32 games played this season, ADO Den Haag has won 4, drew 10, and lost 18 games. They have accumulated 22 points, scored 26 goals, and conceded 69.
Formation
Percentage used
4-2-3-1
17%
4-1-4-1
16%
4-3-3
12%
4-4-2
10%
4-4-1-1
9%
3-4-1-2
4%
5-3-2
4%
3-4-2-1
3%
4-3-1-2
2%
5-4-1
2%
If we look at the table above we see that ADO Den Haag has played 10 different formations during the 2020-2021 season, with all formations being used quite equally. They have also used formations that have a back-three of a back-five, which can be seen in the table above.
Conclusions If we look at all the formations used by the teams we can conclude a few things. The 4-3-3, the 4-2-3-1 and the 4-4-2 are the most used as the all use wingers/wide midfielders – which is something that is coached and encourages a lot in the Netherlands. This is considered to be the default.
If you play with a back-five, you are considered to have a defensive approach and your emphasis lies on defending rather than attacking. It doesn’t matter how the roles/positions are in these formations – it’s considered to be defensive and used when confronting a stronger opponent.
On the other hand if you play with a back-three you are seen as very progressive and an attacking-minded side, which is different from the default of four at the back, three midfielders and three attackers. The 4-3-3 might be a little bit outdated, but the idea of playing with wingers is very present in the Netherlands, especially with Dutch coaches.
Ryan Gauld is somewhat of a hype at the moment, and I’ve seen a few pieces on his performances – that’s why I haven’t written about him before. Although it’s not an excuse, I truly think that too many of the same pieces are not innovative and that’s why I didn’t want to write something trivial on this particular player.
In this article I will have a brief look at his passing in the last five games he played, especially his key passing. After that, I will look more closely to his through passes that he attempted in 2021 via a short video analysis of those passes.
The data is provided by Wyscout and the videos are also downloaded from Wyscout.
Pass clusters In these pass clusters I will look what the most common clusters (4) were in the last four 90 minutes Ryan Gauld played. These game were against Benfica, Famalicao, Belenenses and Boavista.
Key passing statistics in 2020-2021 In the graphs below you can see a few comparisons (scatterplots) in the key passing metrics. In these graphs the 57 best midfielders – according to Wyscout – are included, illustrating how well Ryan Gauld is doing among his peers.
In the graph above you can see the scatterplot for the metrics Passes to final third per 90 and Passes to penalty area per 90. These metrics illustrate how often a pass is played to a specific area of attacking threat where the attackers might create a goalscoring opportunity. In the case of Ryan Gauld, you can see he does quite well in the passes to penalty area per 90 (3,29 passes to penalty area per 90). If we look at the passes to the final third per 90, he doesn’t do as well compared to the other midfielders: 2,86 passes to the final third per 90.
It’s hard to describe what effect a key pass or through pass has without looking at it – which we will do in the video analysis part of this piece – but the attempts to make a pass that contributes to the attack of your team, can be found in the metrics Key passes per 90 and Through passes per 90. We can see that Gauld attempts quite soms key passes per 90 compared to his peers: 0,39 key passes per 90. If we look at the Through passes per 90, he is quite average in passing: 0,78 through passes per 90.
If we look at the data from the key passing metric, surely we are interested to know in what passes lead to a goal or are expected to lead to a goal. We can assess that via the expected assists per 90 and the actual assists per 90, as illustrated in the scatterplot above. Gauld performs very well in this metric among midfielders. He has 0,2 xA per 90 and 0,16 assists per 90 – which compared to midfielders in the Primeira Liga is quite good.
In the two grapsh below you can see how well he does compared to the other midfielders in terms or percentile ranks and in in a beeswarm plot.
Video analysis
I had a look at 5 different moments in 2021 where Ryan Gauld attempted a through ball in the Primeira Liga. In the first two videos you can see that he tries to pass the ball through the defence in order to set up the attackers, but he does follow through when the passes are not received. He follows the ball and presses the opponent.
In both occassions the ball doens’t reach the target, which is the attacker who moves forward to receive the through ball. At that particular moment the ball is lost, but the way Gauld presses – makes sure that the ball is recaptured or the opponent is forced to make a difficult decision, which means more chance to regain possession of the ball.
In the videos above we have seen him turn and give a through ball through the middle. Another option for Gauld is to receive the ball on the flank, wait for the movements of forwards and bring the ball into the assists zone, as can be seen in the video below.
Ryan Gauld is good in giving these kind of through passes from the final third into attacking positions, but he does well in transition from defence to attack as well. He can progress the ball from the defensive third to attacking third quite easily with a through ball that has length.
Final thoughts Ryan Gauld has gotten invaluable experience in Portugal and is having quite the season. His attacking contribution via key passing has definitely sparked interest from scouts and recruitment analysts in Portugal and Scotland, but also in the rest of Europe. Performing in this kind of league with these decisive passes is a hard thing to do. I appreciate this is only a small element of his game, but there’s no doubt interesting stuff to be said about the player.
Data: Wyscout Video: Wyscout Telestration in video: Metrica Play
So, the reason why I started this blog was to write articles about the beautiful game from a technical side; looking at data, scouting, coaching and tactical analysis. My second objective was to expand my knowledge in data scouting beyond Europe. I’ve realised I haven’t too much with it until know, but this article will look at what the best best wingers are/have been in the 2020 MLS season according to the data.
The data I’m using for this analysis is provided by Wyscout and in their database I’ve been looking for the best winger in each metric – which I will mention below. I’m looking at a data set of 30 wingers as we are looking specifically for the best winger and not the best attacker with winger qualities.
In this article I will look at the following metrics:
Goal threat
Crossing
Dribbling
The idea is to assess how well the data was in the 2020 season and whether we need to look at a few good players in the coming MLS season AND to scout a few players who are ready for a move into another league.
Goals and assists
First I will look at the attacking numbers as wingers are often involved with goalscoring or creating the goalscoring opportunities. In the image above you can see the expected assists vs the actual assists in this 2020 season in the MLS. A few players really stand out in this metric: Rodriguez with 0,34 assists per 90, Espinoza with 0,33 assists per 90 and Mihailovic with 0,38 assists per 90. A special focus should be on Quintero, as he created the highest xA of the bunch with 0,36 xA per 90.
In the image below I had a look at the goals scored by the wingers.
If we look at the expected goals per 90 and the goals per 90, there are two players really standing out. Molino with 0,36 xG and 0,66 goals per 90, and Rossi with 0,59 xG and 0,7 goals per 90. These two really stand out and all are slightly overperforming their xG: converting those chances into goals more than the chances would suggest.
Crossing
An important part of a winger’s arsenal is the ability to cross. It definitely depends on the playing styles opted by the club, but when you have attackers or attacking midfielders who play wide, crosses are important. The ability to whip in a cross from the flanks to the players in and around the box, can great a lot of danger from the attacking side.
In the image above you can see who has the most crosses per 90 and the most successful crosses. In the amount of crosses we can Morgan with 6,38 crosses per 90 with an accuracy of 33,12%, Barrios with 4,77 crosses per 90 and 37,37% accuracy, and Espinoza with 4,7 crosses per 90 and 24,56% accuracy – in the top-3. Medina and Ring have the highest accuracy, but they have fewer than 1,5 crosses per game – which makes the accuracy less impressive.
Dribbles
Another important metric to look at is dribbling. The ability to dribble and have a go at your direct opponent, is important for a winger as well. How well does he perform in the 1v1s? These can be partly read in the dribbles data as portrayed above. We can see Mihailovic and Morris with the highest accuracy, but that’s not the most relevant thing about this image. I want to look at the player that make the most dribbles per 90 and have a high accuracy while doing that.
Diaz has 6,28 dribbles per 90 with 60% accuracy, Morgan has 6,67 dribbles per 90 with 59,63 accuracy, Russel has 7,38 dribbles per 90 with 57,23% accuracy, and Pavon has 9,92 dribbles per 90 with 58,26% accuracy. Those four players perform the best in this specific dribbles metric.
Shortlist I’ve only looked at specific metrics, but I decided to look closer at the following players as I thought they are standing out and will prove to be valuable assets to teams: – Cristan Pavon – was on loan from Boca Juniors at LA Galaxy – Lewis Morgan – Inter Miami FC – Diego Rossi – Los Angeles FC
The next step is to look at these 3 players in different games and follow them via video scouting.
It’s time for a data piece again isn’t it? I haven’t written anything on my blog about data and scouting since the beginning of January and it’s time for a new venture. In this article I wanted to look at one specific league and look for a central midfielder. Why a central midfielder? Because I think it’s hard to assess whether a midfielder is a central midfielder in comparison to a defensive/attacking midfielder. I have chosen for the 2. Bundesliga, because it’s a league well-respected, but also a little bit all over the place. It hasn’t been scouted by myself as much as the Championship, Ligue 2 and Serie B – so that’s why I chose this league.
The data I’m using for this analysis is provided by Wyscout and in their database I’ve been looking for the best midfielders in each metric – which I will mention below. I’m looking at a data set of 30 midfielders as we are looking specifically for the best central midfielders and not the best midfielder with central midfielder qualities.
In this article I will look at the following metrics:
Goals & assists
Passing
Dribbling
Defensive duels
Interceptions and sliding tackles
The 30 best players I’ve found on Wyscout are as follows:
When looking at this data, I wanted to have a player to have 900 minutes or more on the pitch (=10 full games in total) and that’s why I excluded Hunt and Kinsombi in my further scouting. The total of players I will look closer at is 28.
Goals and assists
First I will look at the attacking numbers as central midfielders are often involved with goalscoring or creating the goalscoring opportunities. In the image above you can see the expected assists vs the acutal assists in this 2020-2021 season in the 2. Bundesliga. A few players really stand out in this metric: Sessa, Justvan and Kempe. Kempe has a high xA and is right on level with the assists according to that xA. Justvan and Sessa are overperforming, as their assists per 90 are higher than the quality of the passes would suggest.
In the image below I had a look at the goals of these central midfielders.
If we look at the expected goals per 90 and the goals per 90, there are three players really standing out. Muhling with 0,3 xG and 0,37 goals per 90, Green with 0,35 xG and 0,39 goals per 90, and Kempe with 0,31 xG and 0,42 goals per 90. These three really stand out and all are slightly overperforming their xG: converting those chances into goals more than the chances would suggest.
Passing
A midfielder is tasked with a lot of passing. Obviously they are tasked with progressing attacks, but they are also connecting the defence with the attack and have a vital role going forward. In this first visual on passing, I will look at the progressive passes vs progressive runs, to see how well they progress on the pitch.
Four midfielders really stand out with their progressive passing during this season. Becker has 7,3 progressive passes per 90, Riese also has 7,3 progressive passes per 90, Seguin has 8,5 progressive passes per 90, and Sontheimer has 9,4 progressive passes per 90.
As said above, the central midfielders also have a vital role going forward with their passing. In the image below you can see the key passes per 90 vs the through passes per 90.
If we look at the key passes per 90, four players stand out: Jae-Sung Lee with 0,51 key passes, Seguin with 0,53 key passes, Hauptmann with 0,54 key passes, and Zalazar with 0,66 key passes. When we look at the through passes per 90, three players stand out: Becker with 1,33 through passes, Seguin with 1,42 through passes, and Mehlem with 1,89 through passes. Overall, Seguin scores the best in these metrics.
Dribbling
How well do they perform with the ball and maintaining control of the ball? We can look at this with the metric of dribbles. It’s not always possible to pass the ball or sometimes there’s space going forward, so dribbling can be a very important part of a central midfielder’s play.
The best dribblers in this season of the 2. Bundesliga so far are Becker with 3,32 dribbles and 78%, Sessa with 4,09 dribbles and 63,64%, and Justvan with 4,65 with 68%.
Defensive duels
It obviously is not only attack, attack and attack. Defensive positioning and duels are very important. In this metric we will see how well they do in the defensive duels as they assist the defensive midfield in order to strengthen the defensive block.
Kroos (63,11%), Sobottka (63,54%), Becker (64,15%), Fandrich (64,81%) and Morales (65,12%) have the highest percentage of won duels in this season in the 2. Bundesliga, but I’m particularly impressed with Krauss, as he has over 9 defensive duels per 90 with a win percentage of 62,42.
Sliding tackles and interceptions
Part of the defensive actions in a game are the sliding tackles and interceptions. What do they say? Interceptions say something about seeing the problems/opportunities in front of you, while sliding tackles say something about the ultimate defensive action. Obviously it’s different for teams with a lot of possession and teams without possession, that’s why it is adjusted for possession.
What immediately stands out is that Gnjatic has a lot of interceptions and sliding tackles. This means that he is involved in a lot of defensive actions in his games and stands out from the rest with 1,94 sliding tackles per 90 and 7,77 interceptions per 90. I think that Krauss does very well in his forward thinking with 8,38 interceptions per 90.
Short list:
All things considered I’ve made a short list of players who are complete central midfielders according to the data we’ve looked at:
Kempe – Darmstadt 98
Krauss – Nürnberg
Seguin – Greuter Fürth
Sessa – Heidenheim
Becker – St. Pauli.
The next step is to look at these 5 players in different games and follow them via video scouting.
Central forwards or the more general accepted ‘strikers’ are very important for a team for obvious reasons. You might have read many pieces on the best strikers of the ball in the Top 5 and I must admit, it’s very interesting to read. My focus however never has been with those leagues for several reasons, but I think scouting those league are not really feasible when scouting for a non-top 5 league.
If you want to recruit a top striker for your club in one of the Scandinavian leagues, Scottish Premiership, Dutch Eredivisie, Portugese first tier, Austria or Russia – it could prove very useful to look in the same countries as the Top Five, but focus on the second tier. And that’s what I’m doing in this analysis – I’m looking for the best central forwards.
Sample size There are 149 players in my sample across five different leagues:
The English Championship
The Italian Serie B
The French Ligue 2
The German 2. Bundesliga
The Spanish Segunda Division A
These have been selected from Wyscout and they are thought by Wyscout to be the best allround strikers of the 2020/2021 season in their respective leagues. Obviously many players feature for their club in cup competitions and some for their country, but this data is not included in this analysis.
I’ve thought on what the minimum of minutes would for this season and I found 600 minutes to be an acceptable amount of minutes. In the dataset each player has played 10 games with an average above 600 minutes. The reason that I took this relatively low number is because strikers can make an impact more than defensive-minded players in general.
Goalscoring
First we look at the goals scored in comparison to the expected goals in the 2020/2021 season. It shows us the probability of the amount of goals per 90 minutes versus the actual goals scored per 90 minutes in the first viz. In the second you can see the table of the top 10 performers when we look at the amount of goals per 90 minutes.
As you can above is that players with a high xG tend to score more goals, because the probability of scoring a goal is evidently higher. Hamburger SV’s Terodde leads the way with 1,07 goals per 90, followed by Toulouse’s Healey (0,93 per 90) and Lucas João from Reading with 0,91 goals per 90.
Expected goal is a nice metric to measure how big the chance was to convert a ball into a goal. You can also look at how much quality a shot had and measure the xG from there. This happens in the image below.
The scatterplot above shows a couple of things. It shows the data of the player in expected goals per 90 and the data for shots per 90. In terms of expected goals per 90 Terodde again leads the way obviously, but if we look at the amount of shots taken two players are noticeable: Armstrong from Blackburn Rovers and Coda from Lecce. They each produce a lot of shots per 90: 4,79 shots per 90 and 4,9 shots per 90 – but their xG is not as high as Srbeny and Terodde.
Creativity
Next to actually shooting at goal and converting chances, strikers are also judged by their ability to create goalscoring opportunities for other strikers or other attacking players. In the image below you can see how they directly contribute to a goalscoring opportunity.
You can see the expected assists per 90 which tells us the probability of the striker providing a pass that directly leads to a goal and we can the actual assists per 90 minutes that striker provided.
In the scatterplot above we can see five players standing out: Nürnberg’s Lohkemper (0,53 assists per 90), Monza’s Gytkjær (0,38 assists per 90), Erzgebirge Aue’s Testroet (0,38 assists per 90) and Krüger (0,36 assists per 90), and finally, Hannover ’96’s Ducksch (0,36 assists per 90). They contribute from to a goal via assist from 1 in every 3 games to 1 in every two games.
Dribbles
In the scatterplot above I’ve plotted the progressive runs per 90 vs the dribbles per 90. Dribbling can be a vital part of a striker’s movement. The way they move, the 1v1’s against defenders and the way they lure defenders to them, creating space in other sides of the pitch.
If we look at the top performers in these specific metrics, we see three players doing really well: Paris FC’s Laura, Toulouse’s Adli and Monza’s Danny Mota.
Brexit. The word has been used so much that SEO on websites must be greener than green. It will change the recruitment strategy of clubs a lot. In this article I will look at the changes this will give British clubs in looking at European players on mainland Europe and how this will affect how Dutch clubs will recruit in their own country.
After reading this piece on The Athletic by Philip Buckingham, I started to wonder what the effects will be for British clubs going forward. They can’t just simply sign anyone anymore from Europe and if they want to sign players from Portugal, The Netherlands and Belgium (for example), the players have to meet certain criteria.
The FA states the following:
“Post Brexit, clubs will not be able to sign players freely from the EU. Players from EU countries who want to play in the Premier League or EFL will be required to gain a GBE, like all other overseas players without the right to work in the UK.
The GBE will operate a points-based system, where points are scored for senior and talented young players based on: • Senior and youth international appearances • Quality of the selling club, based on the league they are in, league position and progression in continental competition • Club appearances, based on domestic league and continental competition minutes
Players accumulating the requisite amount of points will earn a GBE automatically, while players just below the threshold may be considered for a GBE by an Exceptions Panel.“
The Football’s Governing Body Endorsement (GBE) will have an impact on players wanting to coming to the Premier League or EFL or the clubs that want to recruit them. Furthermore, the British clubs can’t sign a player earlier than his 18th birthday and the number of U21 players signed in a transferwindow is limited (three in january 2021, six in the windows to come).
This means that it will become more difficult for a majority of the players in the Dutch professional leagues, to get recruited by clubs inside the UK. Obviously this means a change in a lot of things, but it can provide some positives for the Dutch clubs.
What positives can we see in this turning point?
Looking at it with a Dutch club’s perspective, this means that many players are more approachable. In reality, clubs could scout and try to recruit in their own country, but players have become too expensive. In what way? If clubs in England, Wales and Scotland are looking for talent in the 2nd tier – their value goes up. That’s the way it goes. If a top 2nd tier club or Eredivisie club wants to recruit them, they have to paint a scenario that’s brighter or better than that of the clubs from the British Isle – very hard to do.
With the British clubs out of the way of recruiting in the 2nd tier or in some cases, the Eredivisie – it could provide an opportunity for top table Eredivisie clubs to recruit in the 2nd tier. You could take more time look at the players and judge them in the same culture as your club is acting in.
There’s the thing of other countries obviously. There are big clubs in France, Germany, Italy, Portugal, Spain and Poland who also love to look to talent in the Netherlands. They operate within the EU and can still recruit in the same way as before – the competition has just become less in numbers.
What has to change in wages?
To become more attractive to talents/players and their agents, the clubs have to change one crucial thing: the wages. This is not simply changed obviously. There is next to no money left for clubs to spend extra on wages and the league does not provide the vast amount of money the big 5 leagues have to offer.
Players from the Championnat National in France do make more money in wages than the average player in the Eredivisie – so that has to change in order to be more appealing to the players in terms of wages. There has to change something structural to be able to compete with the aforementioned leagues – otherwise the players will choose to go abroad and play for non-Dutch teams.
It’s still hard to recruit the toptalents in the 2nd tier, but the chance of signing a player has become slightly bigger with Brexit.
Leagues like the Dutch Eredivisie, the Scottish Premiership, The Danisch Superligaen and the Portuguese Liga Primeira are great competitions to scout in for top 5 leagues, but where do those leagues scout in? There are few obvious options to look at, but in this post I will delve into the best young, central defenders in the French Championnat National – the third tier of French football.
As I have vowed to look at leagues beyond the first tier leagues, I was very interested in the attacking threat of players in the Scottish Championship. In this short data analysis I will look at some of the top finishers and creating of attacking threat, using data by Wyscout.