Analysing corners is part of my daily routine and through the years I’ve been quite fortunate to be able to dedicate my time to it as much. Analysing set pieces can be quite daunting: Where do you start? Where do you gain knowledge? There are great resources out there, but if you want to train your eyes, you need to see what’s happening in those set pieces.
In this article, I will give four different tips and pointers when you start looking at corners and which areas of the analysis are important to understand the basics.
Corner kick
First, we look at what’s happening from the actual kick. What player is taking it? We focus on a few things:
Foot: left of right
Side
Short or long
Inswinging or outswinging
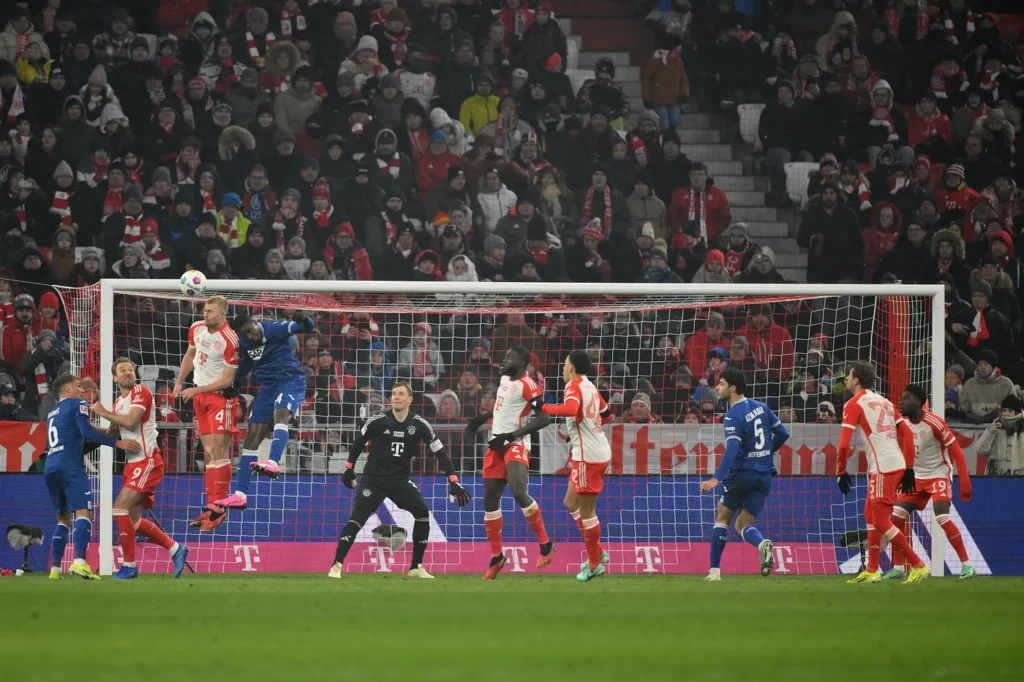
In the image above you can see a corner from Milan in their game against Genoa. The corner is taken from the left of the goal with a player who kicks the ball with his right foot. As the idea is to deliver the ball from that angle, the ball will be inswinging — towards the goal.
Why this basic step is important, has all to do with how the ball will be delivered and how teams will anticipate that. An inswinging ball will affect how a team defends or attacks.
Defensive team
Secondly, we look at what’s happening from the POV of the defensive team. We look at a few things:
Is it a hybrid, man-marking or zonal defence?
Coverage of the post(s)
Zones
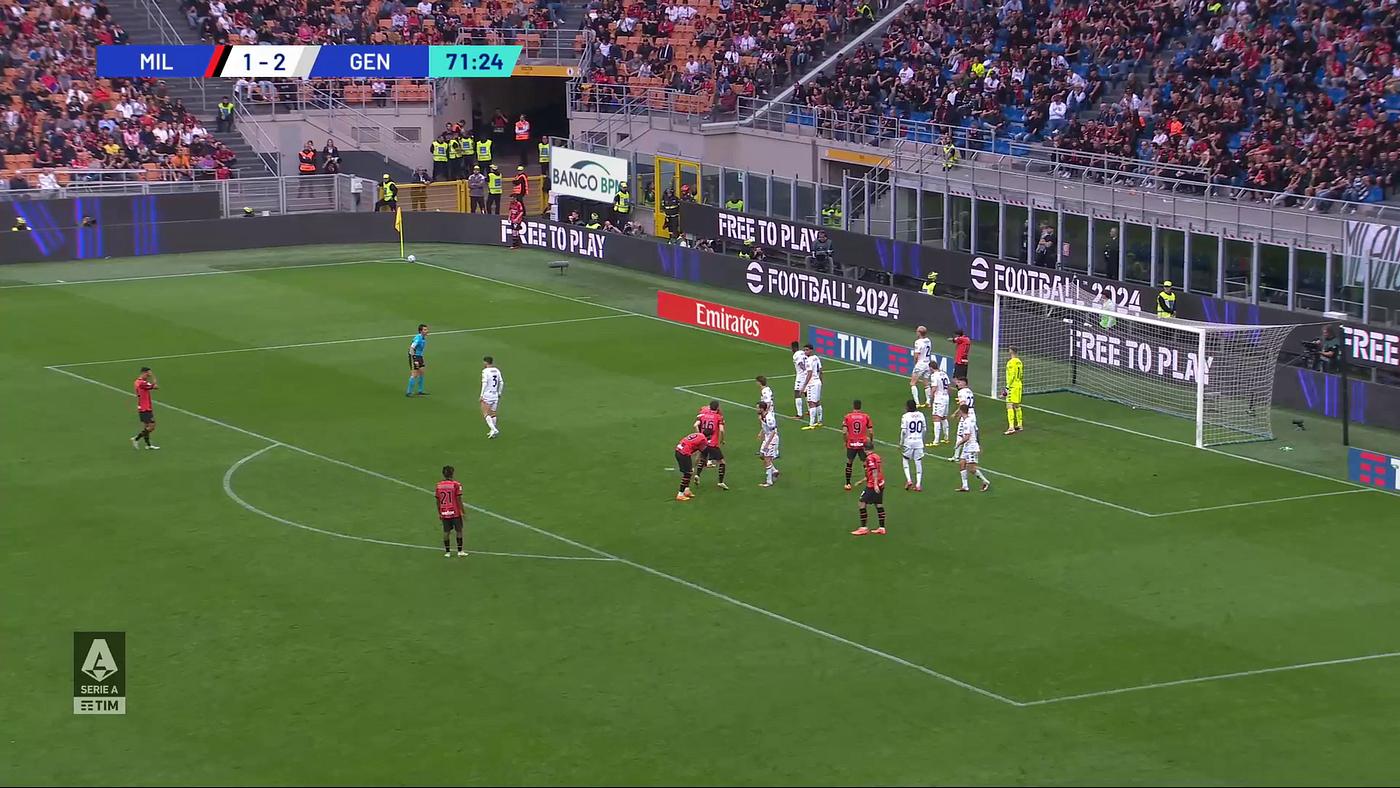
Two seconds later we see that the ball will be kicked and the teams are in position. The defensive team Genoa has a hybrid set-up. They have a man-marking in the front post area marking a Milan player. Furthermore, they have 5 players zonally defending the box: 2 in the front post zone, two in the goalkeeper zone and 1 in the far post zone.
They have three players deeper in the central area, as they are tasked with blocking runs of the Milan players. One player stands deep in the front post zone as he is tasked with the incoming player on the left.
This allows us to focus on what kind of defence they employ, and where they are situated. You can explore their strengths and weaknesses, which is vital for the analysis part that comes after observation.
Attacking team
In the attacking team, we look for how they position before the movement and what their aim is with the attacking corner:
Players’ positioning
Indication of movement
As you can see, Milan have 1 player on the front post occupying at least 1 defender. They have five players outside the six-yard box who will make a run to connect with the ball. They are against four defending players so we see a 5v4 in this area of the pitch with runners vs blockers.
Two players outside the penalty area are there for the second phase of the corner when the first contact is cleared, but they also pose the first line of rest defence in case possession of the ball is lost.
Movement
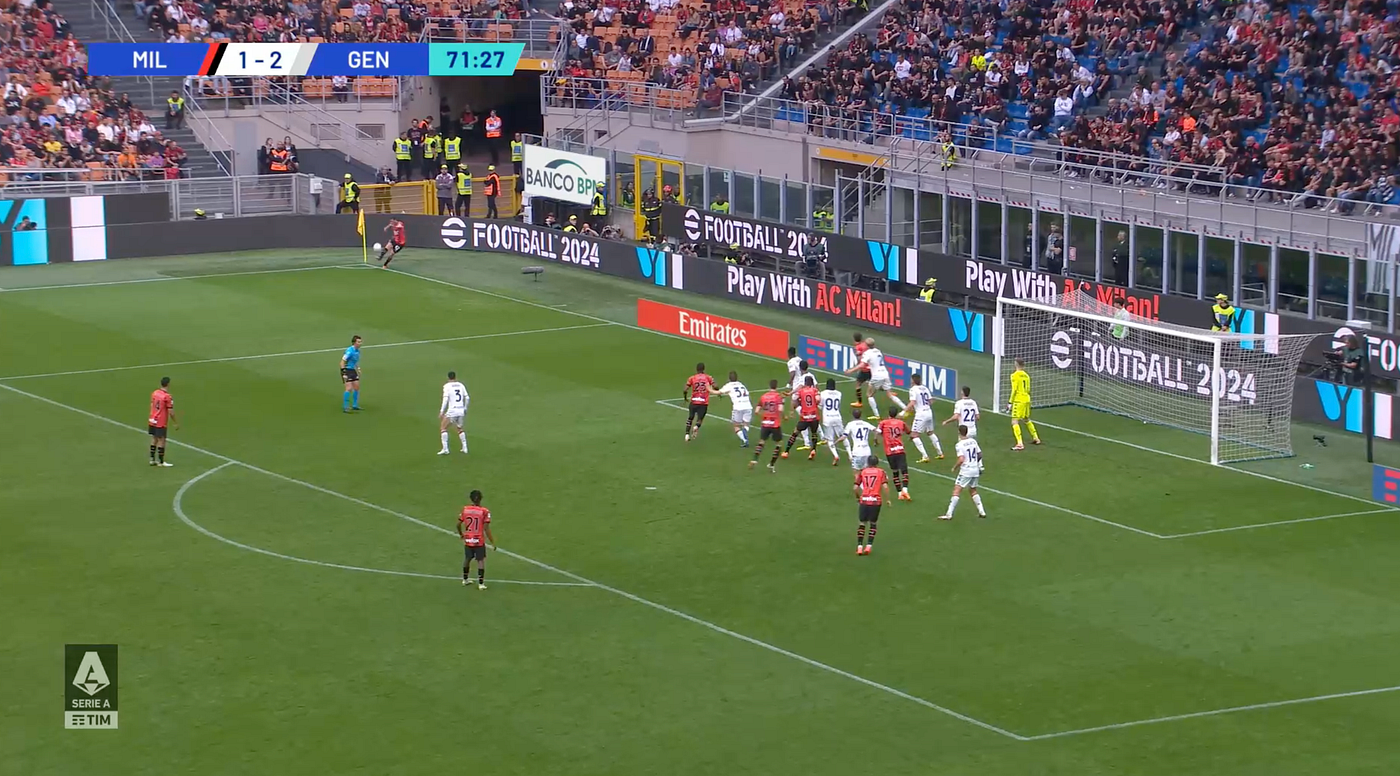
In the movement, which is the most important part — we see that of the five players, four move forward into the front post and the goalkeeper zones close to the six-yard box. This means that this area is crowded and there are players that will be relying on their individual aerial qualities to connect with the ball. The player that remains in his position (#17) has a little bit more space in case the ball goes far and he is a bit more free of his marker.
Eventually, Milan tries to make space for Gabia, who isn’t marked directly due to blocks and he can connect cleanly with the ball.
Final thoughts
If you want to look into watching corners and start analysing them, my advice would be to watch as many as possible. Watch hundreds of them and look at the things I have written above. If you look at the movements, the kicks, the defensive and attacking set-ups — you will at some point really get a grip of what it is that makes corner routines successful or unsuccessful.
In the video above we see Real Madrid in their game against Cadiz. They have a corner from the left and it’s taken by a right-footed player, meaning the ball will swing in towards the goal, rather than swing out away the goalkeeper. Cadiz employs a two-player zonal structure combined with a three-man-marker system.
Real Madrid have one player outside the penalty area who is tasked with being the first line of defence and/or second balls from the corners. There are three players in the six-yard box, who try to make the most of it in terms of dominance – one of these players is tasked with blocking the goalkeeper’s movement. Deeper in the penalty area we see a 3v3 with three runners and three blockers from Cadiz. This is happening against a two-player zonal marking employed by Cadiz.
As soon as the ball is kicked we see that the movement goes to the near post zone as well the goalkeeper zone. At first, the ball is well defended by Cadiz, but Real Madrid keeps their high line in the second phase in what Cadiz doesn’t do. By swinging the ball from a free kick-like angle, they convert this set piece and their approach mirrors that. Cadiz doesn’t do that and stays in the corner defence, which gives Real Madrid to score the header.
Attacking corner routine #2: Real Madrid vs Getafe
In the video above we see Real Madrid in their game against Getafe. They have a corner from the left and it’s taken by a right-footed player, meaning the ball will swing in towards the goal, rather than swing out away the goalkeeper. Cadiz employs a zonal marking scheme against Real Madrid
Real Madrid have two player outside the penalty area who is tasked with being the first line of defence and/or second balls from the corners. There are two players in the six-yard box, that are very close to the goalkeeper and try make his life a hell. There are three players outside the six-yard box who will move up higher in the pitch Deeper in the penalty area we see one player who remains conservative and stretches the defence with his positioning.
As soon as the ball is played, we see a movement of the players to ward the near post. There are three players that are just outside the six-yard box that move towards the near post. Two of them go on a higher pace, dragging their defenders with them. In doing so they open up space for the third Real Madrid player to run behind and then go into that same area as well. Due to this routine, he is unopposed in his run and he has the freedom to head the ball in goal.
Real Madrid has been doing really well with their attacking corners and have scored 5 goals with them. At the end of the season they could hit double numbers and with that, be decisive at very important moments in games in La Liga.
Whilst we are already a few rounds into the Eredivisie 22/23 season, it’s still very interesting to have a look at the 21/22 season. I’m particularly fond of set piece, attacking corners in particular, and how teams try to generate chances from them. In this analysis I will try to do exactly so.
In this analysis, I will attempt to have a look at the shot locations of each team playing in the 21/22 season with data from Opta and look at the zones that give the great threat and/or chances for the attacking side. These will be done via data visualisations with expected goals on target.
The distinction is made between expected goals and expected goals on target (xGOT). This has been done to an idea of which players do have an impact of scoring and actually forcing the goalkeepers to a save or defensive action.
CONTENTS
Theoretical frame: data
Theoretical frame: methodology and tools
Most impactful teams
Teams: Expected goals on target per zone
Teams: successful routines per most successful zone
Final thoughts
THEORETICAL FRAME: DATA
For this analysis, data will be used and there are two types of data that are being used.
The first type of data is so-called match data which focuses on different data metrics that are quantitative. They focus on how many times a certain player makes a certain action that’s translated to a data metric. This will be used for the number of corners taken, the shots generated from them, and the goals. This data has been collected via Wyscout’s data and was collected on Saturday 20th of August, 2022.
The second type of data is event data. This type of data focuses on X and Y locations on the field and records an event. We can collect many data events with this type of data, but in this analysis, we only look at the shot locations and the corresponding values assigned to them. We will then look at the expected goals on target that go along with the shot locations. This filters the shots that are blocked and go wide, to suit the impact analysis we are doing. This data has been collected via Opta’s event data and was collected on Monday 15th of August, 2022.
THEORETICAL FRAME: METHODOLOGY AND TOOLS
With the data we have collected, we have all shots conducted throughout the season in the Eredivisie 21/22. There are two different tools I will use to do the research for our analysis — because we focus on the attacking corners of each side.
The first tool we use is Tableau and we use this for the quantitative data collected via Wyscout. With this, we can make scatterplots and bar graphs quite easily, and give an overview of how well each team is doing. This can be considered as data that lies on the surface and quickly gives us an idea of how the strengths are lined up. We view everything in metrics per 90 minutes, as that gives a better idea of the average performance in set pieces per each team.
For the shot locations, I use a different tool. The data was collected via Python and in Python, I will use this data to do data analysis and to make the visualisations. These visualisations are inspired by Son of Corner and he has an excellent tutorial here, how to make these visualisations.
After loading all the data in my code, I make sure to filter for a few things. Firstly I filter a team, then I filter only expected goals on target and I make sure the data only looks at shots as a consequence of a corner. After I have done this, I can start with making the visualisations and the data analysis.
MOST IMPACTFUL TEAMS
If we look at the most impactful teams in terms of set pieces, we tend to look at the goals scored, as that is what you try to achieve with it. In the graph below you can see this.
In the graph above you see the Eredivisie teams and the corresponding goals scored from corners. It’s interesting to see that 4 out of the 5 top teams in the League, also feature in the top 4 for corners goals scored in the 21/22 Eredivisie season.
As you can see, we see the percentage of all goals scored with attacking corners. Go Ahead Eagles has the most impact via attacking corners goals with nearly 25%. AZ and Feyenoord score high, but it’s remarkable that more lower placed teams, do have a higher percentage. RKC and PEC Zwolle lacked that impact with 5% and 3,85%.
TEAMS: EXPECTED GOALS ON TARGET PER ZONE
In this section we are going to look more closely at each team and which zones they targeted — which zone gave the most expected goals on target (xGOT)?
Ajax
In the visual above you can see where Ajax created the most xGOT. 41% of the xGOT in corners has come from the area at the right post. Most of the xGOT is in and around the six-yard area, indicating they want to have high-quality chances of scoring from corners.
AZ
In the visual above you can see where AZ created the most xGOT. 29% of the xGOT in corners has come from the area at the left post, but also 26% at the right post. Most of the xGOT is in the the six-yard area, indicating they have high quality chances there. What’s interesting is that they have xGOT outside the penalty area.
Cambuur
In the visual above you can see where Cambuur created the most xGOT. 57% of the xGOT in corners has come from the area at the left post, but also 25% at the right post. Most of the xGOT is in the six-yard area, indicating they have high quality chances there. What’s interesting is that they have little to know xGOT outside the six-yard box.
Feyenoord
In the visual above you can see where Feyenoord created the most xGOT. 32% of the xGOT in corners has come from the area at the right post, but also 25% at the left post. Most of the xGOT is in the the six-yard area, indicating they have high quality chances there, but they also have 15% in the right side of the penalty spot. The 4% from far out is fascinating.
Fortuna Sittard
In the visual above you can see where Fortuna Sittard created the most xGOT. 29% of the xGOT in corners has come from the area at the left post, but also 17% at the right post and 20% right of the penatly spot. Most of the xGOT is in and around the six-yard area, indicating they have high quality chances there. What’s interesting is that they have xGOT outside the penalty area from the left corner side, as they had shots on target from that area and even scoring from there.
Go Ahead Eagles
In the visual above you can see where Go Ahead Eagles created the most xGOT. 43% of the xGOT in corners has come from the area at the left post. The two zones after that are on the right side of the penalty spot with 17% and 20%. The distribution of the different zones do seem to indicate a difference in delivery.
FC Groningen
In the visual above you can see where FC Groningen created the most xGOT. 38% of the xGOT in corners has come from the area at the left from the penalty spot, but also 29% at the right of the penalty. Most of the xGOT is generated from there and considering the lower percentages higher or deeper, it’s like that the deliveries were outswingers or deep inswingers.
SC Heerenveen
In the visual above you can see where Heerenveen created the most xGOT. 28% of the xGOT in corners has come from the area at the right post, but also 24% right from the penalty spot. What’s also interesting is that 15% of xGOT also comes from the edge of the penalty area on the right, an indication of a deeper play.
Heracles Almelo
In the visual above you can see where Heracles Almelo created the most xGOT. 36% of the xGOT in corners has come from the area right from the penalty spot, but also 34% at the left area from the penalty spot. Most of the xGOT comes from the areas near the penalty spot, but all the other areas do have a lower percentage. They, however, indicate a variety of deliveries.
NEC Nijmegen
In the visual above you can see where NEC created the most xGOT. 49% of the xGOT in corners has come from the area left from the penalty spot, but also 18% at the left post. A significant percentage (12%) comes the area on the left outside the penalty area.
PEC Zwolle
In the visual above you can see where PEC Zwolle created the most xGOT. 43% of the xGOT in corners has come from the area at the left post, but also 14% at the area next to the right post area. Most of the xGOT is in the six-yard area, indicating they have high-quality chances there. What’s interesting is that the area next to the penalty spot on the right, has 14% of the xGOT.
PSV
In the visual above you can see where PSV created the most xGOT. 21% of the xGOT in corners has come from the area at the left post, but also 31% at the area right from the penalty spot. Most of the xGOT is generated in the four areas closest to the goal, with a total of 70% of the xGOT coming from there.
RKC Waalwijk
In the visual above you can see where RKC created the most xGOT. There us one area where the majority of the xGOT is generated and that is the area at the right post with 61% of total xGOT.
Sparta Rotterdam
In the visual above you can see where Sparta created the most xGOT. In all the four areas right in front of the goal, Sparta created a significant percentage of the xGOT. Together it represents 87% of the generated xGOT of Sparta Rotterdam.
FC Twente
In the visual above you can see where FC Twente created the most xGOT. 24% is on the left post and 25%, just outside that area. Deeper in the penalty there has been generated a significant amount of xGOT as well. This indicates the diversity in shot locations as well as diverse strengths in quality shots.
FC Utrecht
In the visual above you can see where FC Utrecht created the most xGOT. 65% of the xGOT was generated from inside the six-yard box, with 20% of the xGOT generated on the right side of the penalty spot. The xGOT is very focused close to goal.
Vitesse
In the visual above you can see where Vitese created the most xGOT. While there are different areas where xGOT is generated, the focus and majority of the xGOT (52%) comes from the area at the left post. There is xGOT on the areas both sides of the penalty spot, but not as significant as we have seen in the left post area.
Willem II
In the visual above you can see where Willem II created the most xGOT. 38% comes from the right post area and 32% comes from the area on the left of the penalty spot. Away from the right post area there is 22% xGOT generated, but those are the most significant areas for Willem II in corners.
TEAMS: SUCCESSFUL ROUTINES PER TEAM
Ajax
The zone on the right post and in this instance the near post is the zone where Ajax generated the most xGOT. In this case Martinez comes to that area against Vitesse’s zonal structure and heads the ball towards the far corner.
AZ
The zone on the left post and the near post is the area where the most xGOT is generated by AZ. They attack it well here with runners against a zonal structure and head the ball in goal.
Cambuur
For Cambuur, the most attacked zone is the left post zone, which is frequently the near post zone/area from the left. Against the zonal structure they time their runs well and score a goal from that particular area.
Feyenoord
For Feyenoord, the most attacked zone is the right post. Here it’s illustrated with a corner from the left going deep into the far post zone. Linssen times his run well and heads the ball in goal, with most players going to the front post.
Fortuna Sittard
For Fortuna Sittard, the most attacked zone is the left post. Here it’s illustrated with a corner from the right going deep into the far post zone. Scored by Gladon in the zone between the far post zone and the zone there after.
Go Ahead Eagles
Go Ahead Eagles create many high-quality chances and xGOT from the left post. They didn’t do that with direct contact, but with the second or third contact. This can also be seen in this particular example.
FC Groningen
The zone behind the left post zone is the zone where Groningen generates the most xGOT from. In this example they don’t score from a direct contact from a corner, but from the second phase of the corner — good finish.
SC Heerenveen
For SC Heerenveen, the right post is where most of the XGOT is generated. This header goal illustrates the threat from this particulra zone against Willem II.
Heracles Almelo
For Heracles Almelo, the zones behind the six-yard box are the zones where most xGOT is generated. The initial shot doesn’t go in, but that’s where threat comes from and eventually they score.
NEC
In the zone just behind the left post, is the zone where NEC generates the most xGOT. In this particular corner, the ball goes that particular area just behind the near post and the ball is guided to the far post.
PEC Zwolle
For PEC Zwolle, the left post zone is where they generated the most xGOT — but since they have scored one goal from a corner, here is an example of how they attacked the far post. Something they also do from the right.
PSV
Not always a first contact is needed to score a goal. Even in third phase of the corner, PSV keep on pressing. It’s this particular shot zone, where PSV is very dangerous and can hurt the opposition.
RKC
For RKC, the zone with the right post is very important in generating xGOT. In this corner, they play it deeper and head it towards the near post — where Kramer is situated to slot the ball home.
Sparta Rotterdam
For Sparta it’s all about being as close to the six-yard box as possible. This is also done in this corner, as the second phase leads to a cross into the six-yard box and having someone there increases the chance of scoring.
FC Twente
FC Twente generates the most xGOT in the areas left from the left post, in which they try to shoot. They have people on the left side, making sure they can attack those areas as they are left with space.
FC Utrecht
FC Utrecht like to shoot from the right post, as that is where they generate the most xGOT. With corners from the right, this means that the near post will be occupied and shot from — as you can see in this game.
Vitesse
Vitesse likes to attack and generate the most xGOT from the left post zone. You can see that here in the corner from the left side, meaning the ball will swing into the near post zone — and they score form.
Willem II
Willem II had the most xGOT generated on the right post and that is the zone they like to attack with corners. Here they are in the second phase of the corner and make sure someone has a run into the far post.
FINAL THOUGHTS
It’s interesting to look at all the data in front of us and do the actual eye test as well. We want to define and look for threats in the penalty area and in this particular article, I’ve tried to use xGOT as an instrument to analyse what the most threatening zone is while having an attacking corner. We could identify which zones that are per team, but does it also mean that those are the areas/zones the team score from? Not necessarily if I’m being honest.
With many teams this corresponds with each other, but it measures where the chance of scoring is highest according to shots on target. It’s only natural that more goals will be scored from there, but it’s not a given. This you can see with lower ranked teams, who aren’t as good in direct contacts.
The idea that lower ranked teams have a bigger percentage of destined places and direct contacts, can be debunked for a part. Yes, usually set piece are a big share of their scored goals, but the diversity in shot locations and routines, is not to be underestimated.
Set piece analysis. It’s my favourite type of analysis, I think – mostly because of the depth of the routines. In this article I will focus on the attacking corners of Würzburger Kickers in the German 3. Liga. While the club is sitting in 18th place on the table, they have been very good with attacking set pieces. You could say that the attacking corners are instrumental to their goalscoring numbers.
Methodology
In order to make a good and relatively complete analysis on their attacking corners, I ought to look at both their data, as well as their video. I’m writing this article on March 18th, which means that every game after that isn’t incorporated in this article, unless stated otherwise.
The data comes from two sources and that’s rather tricky. Wyscout and InStat both agree that 9 goals have been scored from corner this season, but their definition in the video of what still is a corner attack should always be taken into account. In general Wyscout cuts clips shorter than InStat in terms of set pieces, so it could differ on different ocassions. One should be aware of this.
The match data from 2021/2022 3. Liga will give us insight into the importance of corner goals in relation to the total number of goals scored, which will prove to be insightful as we will also look to rate the impact for Würzburger Kickers. Showing the data will visualise how we can use data, but the actual analysis will take place in the analysis part, where videos will be used in combination with annotations.
Data
Credit: InStat
If we look at the image above, we see that Würzburger Kickers has scored 9 goals from corners this season. In the season so far, the German club has had 168 attacking corners of which 42 resulted in a shot. Effectively, 26,25% of the corners result in a shot and 5,36% of the corners result in a goal.
Looking at the expected goals (xG) for shots on target, we see that Würzburger Kickers have an xG of 5,3 and have scored 9 goals from those situations. This is an overperformance of +3,7 and we will look at how the goals came to be in the next sections. Interesting, however, is the fact that 33% of Würzburger Kickers’ goals this season, have come from a corner and therefore it’s of instrumental importance in attack.
Analysis
Würzburger Kickersvs Borussia Dortmund II
In the video above we see Würzburger Kickers in their game against Borussia Dortmund II. The corner is taken from the right, by a right-footed player. This means that the ball will swing out, away from the goalkeeper.
Borussia Dortmund employs a four-player zonal structure with one player man-marking. Würzburger Kickers have 1 player in the six-yard box and have 3 players making runs in the box. They are divided in two units: 2 on the penalty spot and 1 on the far post zone.
At the moment the ball is played we see all runners move into the six-yard box, with 4 players making movement. There is one player going to the near post zone, 2 players are moving into the goalkeeper zone and 1 player is going into the far post zone. The ball goes into the goalkeeper zone and is headed in goal by Saliou Sané
Würzburger Kickersvs Magdeburg
In the video above we see Würzburger Kickers in their game against Magdeburg. The corner is taken from the right, by a left-footed player. This means that the ball will swing in, towards the goalkeeper.
Magdeburg employs a three-player zonal structure with two players man-marking. Würzburger Kickers have 4 players in the six-yard box and tries to pack the near post zone. They also have 1 player making a run into the six-yard, 1 players on the far post zone and 2 players guarding the rest-defence/cleared balls.
As soon as the ball is kicked, we see movement. We see the player on the far post zone, moving closer to goal and that there are 5 players in the near post zone, ready to attack the cross. That near post zone is where the goal is scored from, as Kickers had overloaded that zone and Tobias Kraulich scored with his head.
Würzburger Kickersvs Havelse
In the video above we see Würzburger Kickers in their game against Havelse. The corner is taken from the right, by a right-footed player. This means that the ball will swing out, away from the goalkeeper.
Havelse employs a two-player zonal structure with 1 player man-marking. Würzburger Kickers have 1 player in the six-yard box. They have 4 players who are making runs into the six-yard box, but they have to face 4 blockers by Havelse in a 4v4 situation on the penalty spot. There are 2 players concerned with cleared balls and/or rest defence on the edge of the penalty box.
As soon as the ball is played, we see the movement going forward. The ball goes to the near post zone, which attracts the most attention – as now there are 2 players in the six-yard box. Kickers connect with the ball and it’s headed into the far post zone. The deepest player is unmarked and has the time to make something of it, and Christian Strohdiek scores the goal.
Würzburger Kickersvs Kaiserslautern
In the video above we see Würzburger Kickers in their game against Kaiserslautern. The corner is taken from the left, by a right-footed player. This means that the ball will swing in, towards the goalkeeper.
Kaiserslautern employs a three-player zonal structure with 1 player man-marking. Würzburger Kickers have 4 player in the six-yard box. There is 1 runner coming into the six-yard box. There are 2 players concerned with cleared balls and/or rest defence on the edge of the penalty box.
As soon as the ball is played, we see the movement going forward. The six-yard box is packed and it’s individual strength that leads to the goal, as Kraulich wins his aerial duel and heads the ball in, from the goalkeeper zone.
Swiss football is truly amazing. It always feel like a bit of an acquired taste or for the more hardcore fans, but it’s truly amazing. In this article I will have a look at St. Gallen playing in the Swiss Superleague. I will focus on their attacking corners.
The attacking corners are so important for teams to make an impact and it can give you a clear chance of scoring if done correctly. In this analysis I will analyse the successful corner routines which resulted in a goal for St. Gallen. The video footage is from Wyscout.
FC St. Gallen vs Basel
In the video above we see St. Gallen in their game against FC Basel. They have a corner from the right and it’s taken by a right-footed player, meaning the ball will swing out away from the goal, rather than swing in towards the goalkeeper. FC Basel employs a two-player zonal structure combined with a single man-marker.
St. Gallen have one player in the six-yard box who is marked. There are two players outside the penalty area who are tasked with making something of the cleared balls but are also tasked with forming the first line of rest-defence in the case of a counter-attack. On the penalty spot, we have one player, and behind that, we have a unit of three players who will make runs into the six-yard box.
As soon as the ball is kicked we see that the player in the six-yard box, as well as the player on the penalty on the spot – move to the near post zone. While one player goes deeper away from the goal, the other remain in that area and is joined by one from the unit. The other go to the goalkeeper zone outside the six-yard box. The ball eventually lands in the near post zone and it’s Youan who scores the goal with his in the near corner.
FC St. Gallen vs FC Zürich
In the video above we see St. Gallen in their game against FC Zürich. They have a corner from the left and it’s taken by a right-footed player, meaning the ball will swing in towards the goal, rather than swing out away from the goalkeeper. FC Zürich employs a two-player zonal structure combined with a single man-marker.
St. Gallen have one player in the six-yard box who is marked. There are two players outside the penalty area who are tasked with making something of the cleared balls, but are also tasked with forming the first line of rest-defence in the case of a counter-attack. On the penalty spot we have a unit of four players who will make runs into the six-yard box and behind them is another player who will make a deep, late run.
As soon as the ball is kicked we see movent in the penalty area. We see two players moving to the near post and one to the far post. This means three players are moving forward in the central areas. The ball is delivered exactly there and due to the runs of the other players, these three have space and time to convert the corner into a goal. In the end, it was Diakité scoring the goal.
It’s day 13 of blogmas already with this time’s attention for the Primeira Liga in Portugal. In this article, I will focus on attacking corners done by Sporting Clube de Portugal, as they are the most successful with scoring from corners. Currently, they have scored 5 goals from attacking corners.
In this analysis, I will analyse 3 different successful corners, look at their routines and explain why these were so successful in the league. The video footage is from Wyscout and has been retrieved on December 13th 2021.
Sporting CP vs FC Paços de Ferreira
In the video above we see Sporting CP in their game against Paços de Ferreira. They have a corner from the left and it’s taken by a left-footed player, meaning the ball will swing out away from the goal, rather than swing in towards the goalkeeper. Paços de Ferreira employs a five-player zonal structure, meaning that Sporting CP will predominantly use late runners to disturb their zonal structure.
There is one player in the six-yard box, in the far post zone, and man-marked by Paços de Ferreira. We then see three different units: two players in the near post zone, two players on the penalty spot and one in the far post zone, together with that other player. Outside the penalty area, we see two players who are tasked with cleared balls but also do function as the first line of rest defence in the case of a counter-attack.
As soon as the ball is played we see movement in those players, four players move into the near post zone, while one player goes to the goalkeeper zone. The player in the goalkeeper zone has the space to head the ball and guides it to the near post again. After which it is converted into a goal by one of those four players standing at the near post. The pace of the attacking side is higher and therefore they surprise Paços de Ferreira.
Sporting CP vs Vitória SC
In the video above we see Sporting CP in their game against Vitória SC. They have a corner from the left and it’s taken by a left-footed player, meaning the ball will swing out away from the goal, rather than swing in towards the goalkeeper. Vitória SC employs a six-player zonal structure, meaning that Sporting CP will predominantly use late runners to disturb their zonal structure.
There is one player in the six-yard box, in the near post zone, and man-marked by Vitória. We then see two different units. We see two players making their way into the near post zone and we see three players who are making late runs into the six-yard box too. Outside the penalty area, we see one player concerned with the cleared balls and/or rest defence.
Those three deep, late runners are of vital importance to the success of this corner routine. These three players have the greatest distance to cover and they can go into that six-yard box because these runs are effective against a zonal structure and all three of them have space. In the end it’s a good header that scores the goal for Sporting CP.
Sporting CP vs FC Famalicão
In the video above we see Sporting CP in their game against Famalicão. They have a corner from the right and it’s taken by a right-footed player, meaning the ball will swing out away from the goal, rather than swing in towards the goalkeeper. Famalicão employs a five-player zonal structure, meaning that Sporting CP will predominantly use late runners to disturb their zonal structure.
There is one player just outside the six-yard box, and will make his move into it. Then we have two players in the near post zone and two players on the penalty spot. There is also one player in the deep far post zone, who is in the penalty area. He is available for a shot, but will also deal with cleared balls.
As soon as the ball is kicked we see that the ball is going to the near post zone and one of the two players that were on the penalty spot makes a run to that zone and connects with it. The ball is guided to the area between the far post zone and the goalkeeper zone – the other player who starts at the penalty spot has space and time to finish the ball: goal for Sporting CP.
It’s day 9 of blogmas already with this time attention for the Championship in England. In this article I will focus on attacking corners done by Huddersfield Town, as they are the most successful with scoring from corners. Currently they have scored 7 goals from attacking corners.
In this analysis, I will analyse 3 different successful corners, look at their routines and explain why these were so successful in the league. The video footage is from Wyscout and has been retrieved at December 9th 2021.
Huddersfield Town vs Peterborough
In the video above we see Huddersfield Town in their game against Peterborough United. They have a corner from the left and it’s taken by a right-footed player, meaning the ball will swing in towards the goal, rather than away from the goalkeeper. Peterborough United employs a two-player zonal structure, meaning that Huddersfield Town will have more opposition in the second line of the set up.
There is one player in the six-yard box, pinned against the goalkeeper and man-marked by Peterborough. We then see a unit of runners, posing as a train. These are five players who will go forward into the six-yard box as soon as the ball is played.
When the ball is played we see movement. The unit breaks up as the ball is played with two runners going to the near post zone, two players going into the goalkeeper zone and one player going to the far post zone. The ball is header from the far post zone into the goalkeeper zone, where Ward connects with the ball and scores the goal.
Huddersfield Town vs Blackpool
In the video above we see Huddersfield Town in their game against Blackpool. They have a corner from the right and it’s taken by a left-footed player, meaning the ball will swing in towards the goal, rather than away from the goalkeeper. Blackpool employs a four-player zonal structure, meaning that Huddersfield Town will likely make runs into the six-yard and be dangerous.
There is one player in the six-yard box, pinned against the goalkeeper, but isn’t man-marked. There is one player for the short corner option on the right and we have a unit of runners to the left, beginning at the far post zone. Again, this a unit of five players. On the edge of the penalty area there is another player who is tasked dealing with cleared balls and is the first line of rest defence in the evens of a counter-attack.
As soon as the ball is kicked we see that the player for the short corner option sprints to the edge of the penalty area. At the same time we see those five runners making their way into the six-yard box: goalkeeper zone and far post zone. These runs will have more effect, because there is a zonal marking scheme. In the end, the ball goes to the goalkeeper zone and because of the runs and movement, the player closest to the keeper can head the ball in and score a goal.
Huddersfield Town vs Fulham
In the video above we see Huddersfield Town in their game against Fulham. They have a corner from the right and it’s taken by a right-footed player, meaning the ball will swing out away from the goal, rather than towards the goalkeeper. Fulham employs a two-player zonal structure, meaning that Huddersfield Town will have to be creative in their runs.
There is one player in the six-yard box, pinned against the goalkeeper, and is man-marked. There are two players standing outside the penalty area who are tasked with dealing with cleared balls and are the first line of rest defence in case there is a counter-attack. There is a unit of five who will try to make runs in the six-yard box, but they are guarded by blockers, making it a 5v5 in the deep zone.
As soon as the ball is kicked we see movement going on. The unit of five splits in one unit of four + a player making a different run. The four players move towards the goalkeeper zone, while the other player moves into the near post zone. By moving in different directions and making runs against the zonal structure, they create space for themselves in the six-yard box, which Pearson utilises and scores a goal.
I think that analysis of French women’s football isn’t done a lot, but when it is done – it usually does consist of Olympique Lyonnais Féminin. I’m not doing anything different in this particular article, but I’m focusing on the set pieces aspect of their current 2021/2022 season.
In this shorter set piece analysis, I will analyse two successful attacking corners which have resulted in a goal for the Lyonnais outfit. The video is retrieved from Wyscout.
In the video above you see Olympique Lyonnais in their game against EA Guingamp. They have a corner from the left which is taken by a left-footed player, meaning the ball will swing away from the goal rather than towards the goal. Guingamp employs a two-player zonal structure in the six-yard box.
There is one player for a short corner option, while two other plays are positioned deeper on the field. They are tasked with dealing with cleared balls, but also as the first line of defence. In the penalty area, we see one player in the six-yard box and a unit of four runners, who are deeper in the penalty area. They will make a movement towards the six-yard box.
The ball is played short and is not taken as an outswinger, but as an inswinger to the edge of the penalty area. The idea is to get the ball headed into the area between the six-yard box and the penalty spot as that is the area where danger is created a lot. This ball bounces back and because of the nature of the players to sit in and around the penalty area, Olympique Lyonnais score a fantastic volley from that particular area.
In the video above you Olympique Lyonnais against Stade de Reims with a corner from the right. This corner is taken by a left-footed player, meaning the ball will swing towards the goal rather than away from the goal. Stade de Reims employed a two-player zonal structure.
There is one player for the short pass option and two players standing outside the penalty area. They are tasked with the cleared balls, but also form the first line of rest defence in case a counter-attack happens. There is one player in the six-yard box and she is man-marked. There is a unit of 4 runners who come from deep and are late, who will charge against the zonal structure and attempt to head the ball in the goal. There is also one player on the penalty spot, who will move towards the near post zone.
As soon as the ball is played we see the player in the six-yard box and the one on the penalty spot, moving towards the near post zone. The four runners try to go into the six-yard box as well and occupy the far post zone. The ball is played, however, to the player standing on the edge of the penalty area, who is not pressed while she is on the ball and she has the space and time to shoot. She does this successful and scores a goal for Olympique Lyonnais Féminin.
Manchester United. There has been plenty of buzz around that club lately and let’s be honest, there’s always stuff going on in the red side of Manchester. I’m not writing this piece in the light of OGS leaving or Ralf Rangnick coming to the club, but I wanted to have a look at what Manchester United does with their attacking corners in the Champions League.
A club like Manchester United is expected to be dominant on the ball, but in reality – some clubs are better and will be more dominant. This can especially be seen in some Champions League fixtures. Winning a corner and converting it into a goal is something huge in those games, and set piece can have a big impact in these high-profile matches. So, what does Manchester United do with their routines to maximise their results?
In this article I will first have a look at the data and draw a few conclusions from there, then I will look to the placement of the first contact of the corner, followed by the second contact, and then I will provide video analysis. This video analysis will look at the corner routines used and what is being done in the second phase of that particular corner.
Data and video come from InStat and Wyscout, and are collected on Monday, November 29th, 2021.
Data
Data is a wonderful tool to support what you see with your eye, but first we need to contextualise and define the data. We are working with two different data providers who give two different ideas of what a corner entails and how long a corner clip is. So if we look at what Wyscout provides, we see 20 attacking corners in the 5 Champions League games played so far and if we look at Instat we see 26 attacking corners in those same games. After having a look at them, I made the decision to look at the 20 corners and figure out the routine, as some corners have been counted twice in the InStat database due to extensive second phases.
If we look at the actual data we can see that 11% of the attacking corners have gone to the goalkeeper zone in the middle, the zon where the keeper is dominant or should be dominant. 24% of the attacking corners goes to the near post zone, which is 21% from the left side and 3% of the right side. 3% of the attacking corners goes the far post zone and this is only when corners are taken from the right side, from the left side none of the corners went to the far post zone. 18% of the attacking corners goes to the 11-meter zone, 11% from the left side and 7% of the right side.
First contact
In the image above you can see the first contacts from corners taken from the left. There were 13 corners from the left. Manchester United tried to deliver the majority of the attacking corners to the near post zone, but only one first contact in that area was won: a direct header from Ronaldo. As we can see too is that they have played the corner short to Rashford (1x) and Shaw (2x) – they attempted to deliver the ball into the six-yard box from a different angle.
In the image above you see the attacking corners taken from the right, which is 7 in total. They tried to deliver them to the near post again, with one header on target by Maguire. There is one first contact last to the far post zone, which wasn’t touched anyone and therefore resulted in a goal kick. Two corners were taken short, of which Rashford (2x) was the recipient. He tried to swing the ball into the six-yard box with a more advantage for the incoming runners, which we will discuss later.
Second contact
We have looked at the first contact so far, but let’s have a look at what the second contacts were from corners. Not all corners can be a direct shot on goal, and second contacts can be very important for the attacking corners.
From the left side we see two first contacts that lead to shots – in this I mean this person is the first contact, rather than only the first touch – and we see three shots after a first contact lost, just outside the penalty area. What we can conclude is that Manchester United do lose the first contact in the penalty area quite some bit, but their second contact is won almost the entire time.
From the right side, we see one first contact that leads to a shot – in this I mean this person is the first contact, rather than only the first touch – and we see one shot after a first contact lost, just outside the penalty area. What we can conclude is that Manchester United do lose the first contact in the penalty area quite some bit, but their second contact is won almost the entire time. The ratio between lost-won first contact is a bit more balanced when looking at the right side.
That second ball is very important and can be illustrated by two examples from corners from the left, which you can find below.
These two examples illustrate how Manchester United set up to do something with the second ball. They might lose the initial first contact in the near post area – which is logical, as this is defended the best. They do however react to it by having three men anticipating the second ball and ready to have a shot on target. This is different to many teams, as they only employ one or two people doing that – but even then, they will focus more on the first line of rest defence rather than having a shot on target.
So yes, excellent use of the second ball to maximalise the goalscoring opportunity, but the initial delivery and placement of the corner quick is questionable if you want an impact from the first contact.
Video analysis
For the video analysis, I’m going to focus on routines that Manchester United employed in those five matches against Villareal, Atalanta and Young Boys. Now we have seen how the near post isn’t utilised successfuly and we have seen that shots from second balls lead to chances, but in the examples below I’m going to look at the routines that made sure there were direct shots from a corner kick.
In the video above you Manchester United against Atalanta in the Champions League. The ball is taking from the right by a right-footed player, meaning the ball will swing out from goal towards the penalty spot. Atalanta employs two lines of zonal marking, with a three-player zonal structure in the six-yard box.
We see three players outside the box tasked with dealing with second balls and preparing the first line of rest defence, but as we have seen in the sections above, they also prepare to shoot from the second phase of this attacking corner. There are five players in the penalty area who are Manchester United and four of them (Cavani, Ronaldo, Pogba and Lindelöf) are allowed to roam freely, only Maguire is man-marked in this corner.
As soon as the ball is kicked we see movement from those five players. Where Cavani moves out towards the corner, Pogba inverts into the six-yard box and together with Ronaldo forms a unit that will move towards the goalkeeper zone and near post zone. Lindelöf also moves towards the near post zone. Maguire needs to lose his marker, which he does, and then assumes the position from the penalty spot towards the six-yard box. He manages to get a header because of the movement of other players, the vulnerability of runners against a zonal marking defence and the delivery of the corner.
In the video above you Manchester United against Villarreal in the Champions League. The ball is taking from the left by a left-footed player, meaning the ball will swing out from goal towards the penalty spot. Villarreal employs a two player zonal structure with one man-marker – the one marking Lindelöf here.
We see three players outside the box tasked with dealing with second balls and preparing the first line of rest defence, but as we have seen in the sections above, they also prepare to shoot from the second phase of this attacking corner. We actually see five players in the penalty area again, but they have set up differently. One player is pinned against the six-yard box, while a unit of four makes runs towards that six-yard box. That unit of four consists of Pogba, Ronaldo, McTominay and Varane.
As soon as the ball is kicked we see that 1-4 formation change into a 1-1-3 formation with the rush of Ronaldo being significant in this one. While he accelerates, the three attacking runners still move forward. In the end Ronaldo’s ability to rise above the defenders gives him a chance to convert the header into a goal, but his attempt is too high. Instrumental to Ronaldo’s run is McTominay’s block in the beginning of the routine, wihch gives hum space to run and attack the vulnerability of the zonal marking of Villarreal.
Final thoughts
It’s hard to draw conclusions from a small sample (just 20 corners) and a competition which is so different from a domestic league, but the importance of instant impact is high in the Champions League. In terms of first contacts Manchester United didn’t create much, as you can have seen from the first contacts lost in the near post zone. In terms of second contacts/balls, Manchester United do anticipate well and almost every time win the second ball after a corner – which means they can shoot or build an attack from that possession of the ball.
The quality of chances however and converting them is something to discuss later on in the season, where a bigger sample can be researched and seen if they make the right choices in finishing, but for the Champions League – Manchester United need to work on their direct impact from attacking corners.
The season has well started in most of the leagues and that means that set-piece analysis of goals from attacking corners can be done. My attention goes to the Belgian Jupiler Pro League and I will analyse KAS Eupen’s attacking corners in the 2021/2022 season.
KAS Eupen is one of the suprising performing teams of the Jupiler Pro League and one of their remarkable performances can be found in the execution of their set pieces. In this analysis I will look at two of their successful attacking corner routines.
KAS Eurpen vs KRC Genk
In the video above we see KAS Eupen in their game against KRC Genk. They have a corner from the left and it’s taken by a left-footed player, meaning the ball will swing out towards the penalty spot, rather than towards the goalkeeper. KRC Genk employs a seven-player zonal structure, meaning that KAS Eupen will do something different in the six-yard box.
There’s one player on the left, being used as a short option and there are two units of three that have attacking options going forward. The first trio is situated on the penalty spot and is tasked to move as close as possible to the six-yard box and attack the ball when it comes in that specific zone of the pitch. The other trio consists of two players on the edge of the box and one player who stands a bit deeper. Two of this particular trio are tasked with cleared balls and/or the rest defence.
As soon as the ball is kicked the ball moves towards the penalty spot. The trio on the penalty spot spreads wide in order to enhance goalscoring opportunities, but also to make it more difficult to defend this corner. At first Genk can deal with the ball, but the cleared ball comes back to a player from the deeper trio who has made a run forward, and has a quality finish from that second contact.
KAS Eupen vs OH Leuven
n the video above we see KAS Eupen in their game against OH Leuven. They have a corner from the right and it’s taken by a left-footed player, meaning the ball will swing in towards the six-yard box, rather than towards the penalty spot. OH Leuven employs a four-player zonal structure, meaning that KAS Eupen will do something different in the six-yard box compared to their game against KRC Genk.
We have one player in the six-yard box who’s man-marked by the opposition. There are four player zonally marking against a trio of runners who are trying to break into the six-yard box. There is one player concerned with a short corner option and there are two players outside the penalty area who are tasked with cleared balls and/or rest-defence.
As soon as the ball is kicked, there are three different movements happening. The first one is that the player for the short corner option will move into the penalty area, meaning there is one more player in the penalty area. Secondly, the trio splits again, one to the front post, one to the goalkeeper zone, and one to the far post – the far post has two players because the player already in the six-yard box goes to there as well. Thirdly, we see the front post player moving forwards as well which means he has an inch of space that gives him an advantage. That advantage is enough for him to head the ball into the far corner and score.