

The German Bundesliga is the highest tier in German football and while the most excitement can be found one tier below, the Bundesliga does have some fantastic narratives and stories. One of those narratives is that Borussia Dortmund should be the main contender for Bayern München, but with Terzic as head coach, there are so many things going very well and very wrong.
So in this statistical analysis, I will use data to conclude if my eyes/feelings are correct or that it is quite contrary. The focus of this analysis will be on how Dortmund creates goalscoring opportunities with the ball.
Contents
- Data
- Methodology
- Analysis: Passing in the opposition’s half
- Analysis: Expected threat
- Analysis: Moving average xG — xGA
- Analysis: Expected goals
- Final thoughts
Data
The data used in this article comes from three different sources and I will tell you why I’m using different sources. I’m primarily using expected goals as a way of determining the performance of BVB, but every xG model is different. I want to show the difference between those models and how these data models can lead to various conclusions and explanations.
The data comes from Opta and my own model. Giving two different options with two different variables and variances, to give a complete picture.
The data will be from event data as well as match-level data from the Bundesliga 2023–2024 and was collected on Saturday 2nd of December 2023.
Methodology
Using the data from my resources, I will do the analysis. The analysis can be divided into three distinct categories: expected goals, expected threat and final third passing. I’ve chosen these specific categories because I want to measure progression and the effect of it on the expected threat and expected goals. This stems from the fact that I want to know whether the narrative of Terzic’s BVB is warranted or not.
The data is downloaded, scraped and collected from the sources given above. This data will be made visual through data visualisations made in Python. My data model is based on 400.000+ shots and uses Opta event data to generate the expected goal numbers.
Passing in the opposition’s half
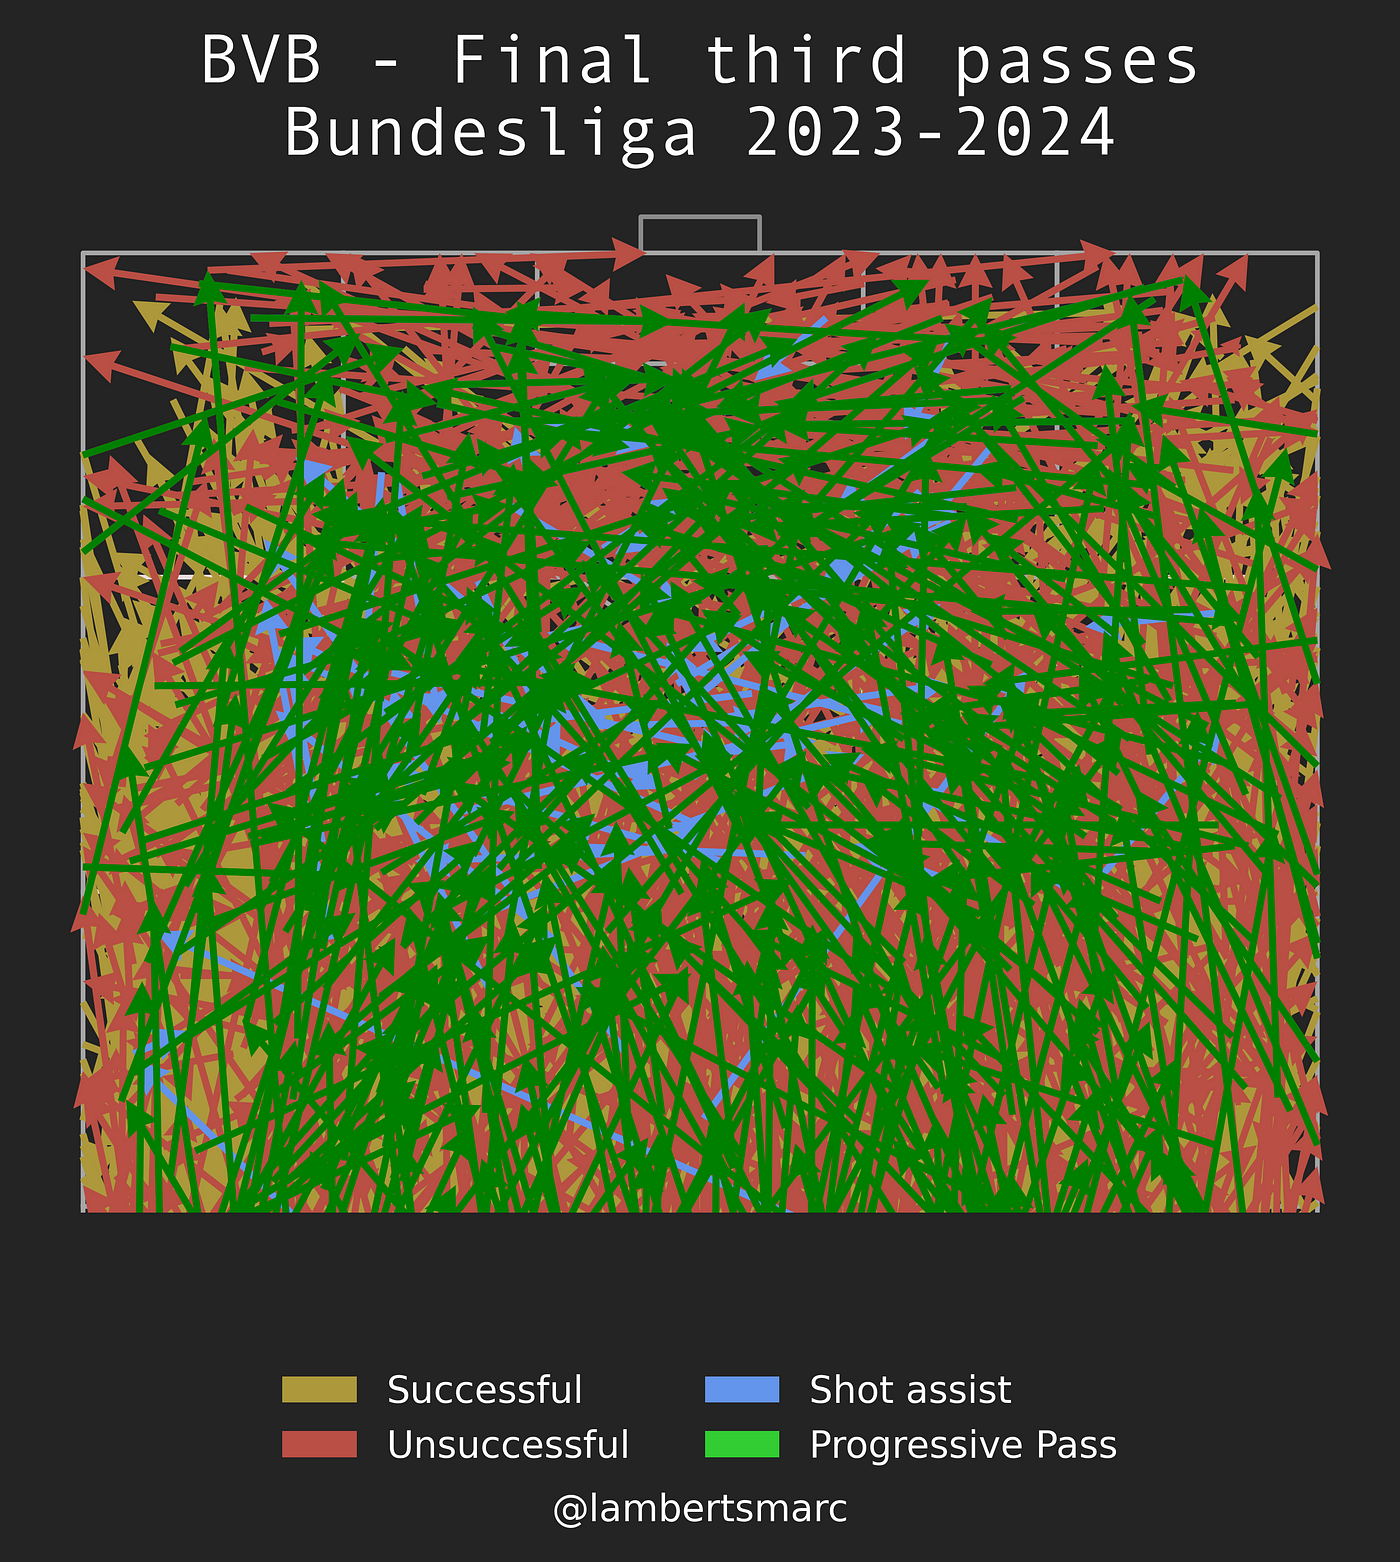
In the image above you see all passes in the opposition’s half conducted by Borussia Dortmund and it gives a lot of information, but at the same time completely nothing. You can’t make this work so I will split this into two different things:
- Shot assists (all passes that lead to shots)
- Passclusters (the most common pass clusters) to illustrate which 4 clusters are the most common. In other words, which kind of pass does BVB use the most?
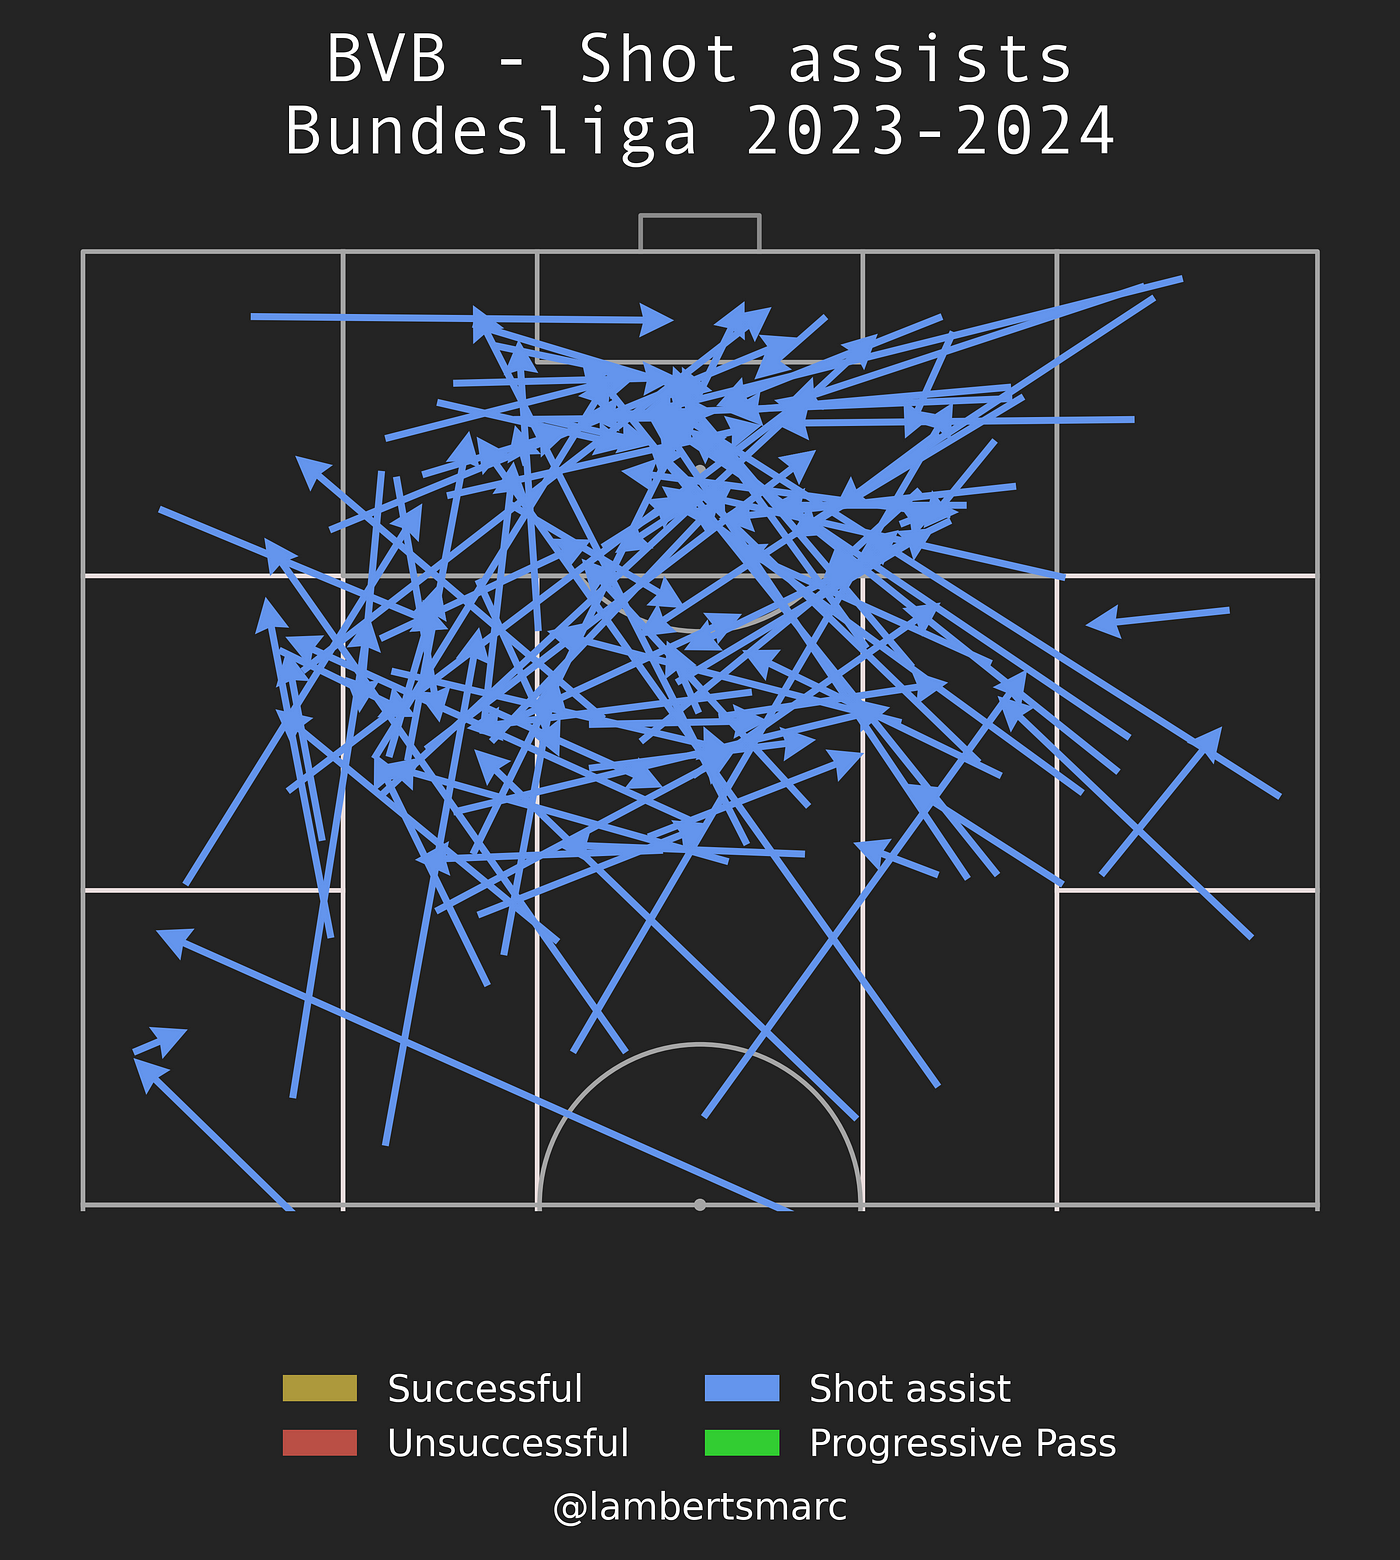
Now we can distinguish it a bit more and we see that a lot of the shot assists come from zone 14 or the central zone just in front of the penalty area. What’s more interesting in my opinion is that many shots assists on the right side of the pitch — both wide area and half spaces — are long passes, while on the left there are more short/medium passes. This can illustrate the way BVB want to attack on that side of the pitch.
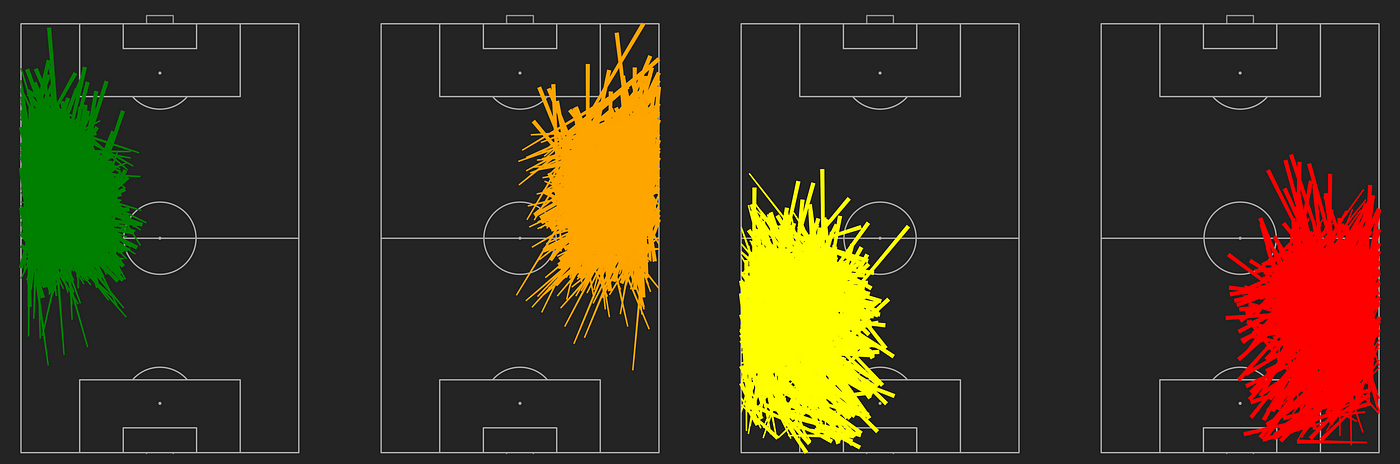
Here you can see the most common pass clusters. The type of passes based on similarities. The green cluster is the most common with 1055 passes, then the orange follows with 984 passes, then yellow with 897 passes and fourth is red with 835 passes.
We can look at this and conclude many things, but most importantly, it gives us an indication of the playing style. It gives us the idea that BVB want to play close to the line and pass close to the wide areas, in order to create something meaningful from that.
Expected threat
How can we measure progression in passing? How do we give value to the passes in terms of how much they add to potentially creating a shooting chance? There are different ways to do so, but in this article I will use expected threat.
The basic idea behind xT is to divide the pitch into a grid, with each cell assigned a probability of an action initiated there to result in a goal in the next N actions. This approach allows us to value not only parts of the pitch from which scoring directly is more likely but also those from which an assist is most likely to happen. Actions that move the ball, such as passes and dribbles (also referred to as ball carries), can then be valued based solely on their start and end points, by taking the difference in xT between the start and end cell. Basically, this term tells us which option a player is most likely to choose when in a certain cell, and how valuable those options are. The latter term is the one that allows xT to credit valuable passes that enable further actions such as key passes and shots. (Soccerment)
Borussia Dortmund has a total expected threat of 48,62 from 7143 passes. When we only look at the successful passes we see that the expected threat is 17,20 from 5983 passes. We can conclude that BVB will use more safe passes and more neutral/negative passing to maintain possession rather than looking for the high threat passing.
If we just look at the successful progressive passing we see that there were 431 passes which accounted for 14,26 total expected threat. In general, we can say that progressive passes do lead to a higher xT.
Expected goals: moving averages
We have seen how we can value passing actions and where BVB do pass to the most, but how does this translate into expected goals. In other words, how are BVB doing in terms of expected goals?
First I want to have a look at how they are doing in producing expected goals and how they are conceding them, which gives us an idea of how likely it is that they are winning games.
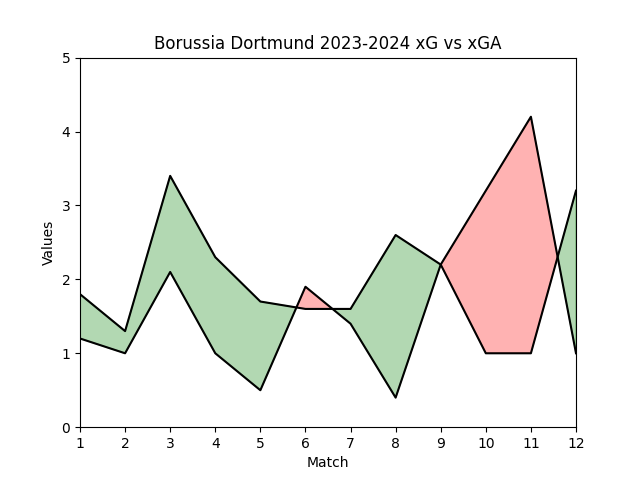
As you can see BVB generated more xG than they conceded, but they had a difficult spell in matches 9, 10 and 11 (playing against Eintracht Frankfurt, Bayern München and Stuttgart) in which they didn’t have a positive expected goal difference.
Expected goals
Expected goals is a metric that has been used a lot recently, and it can help us in assessing long-term probability. We can do this by measuring the actual goals against the expected goals, and this helps us to see whether the chances created have been of sufficient quality.
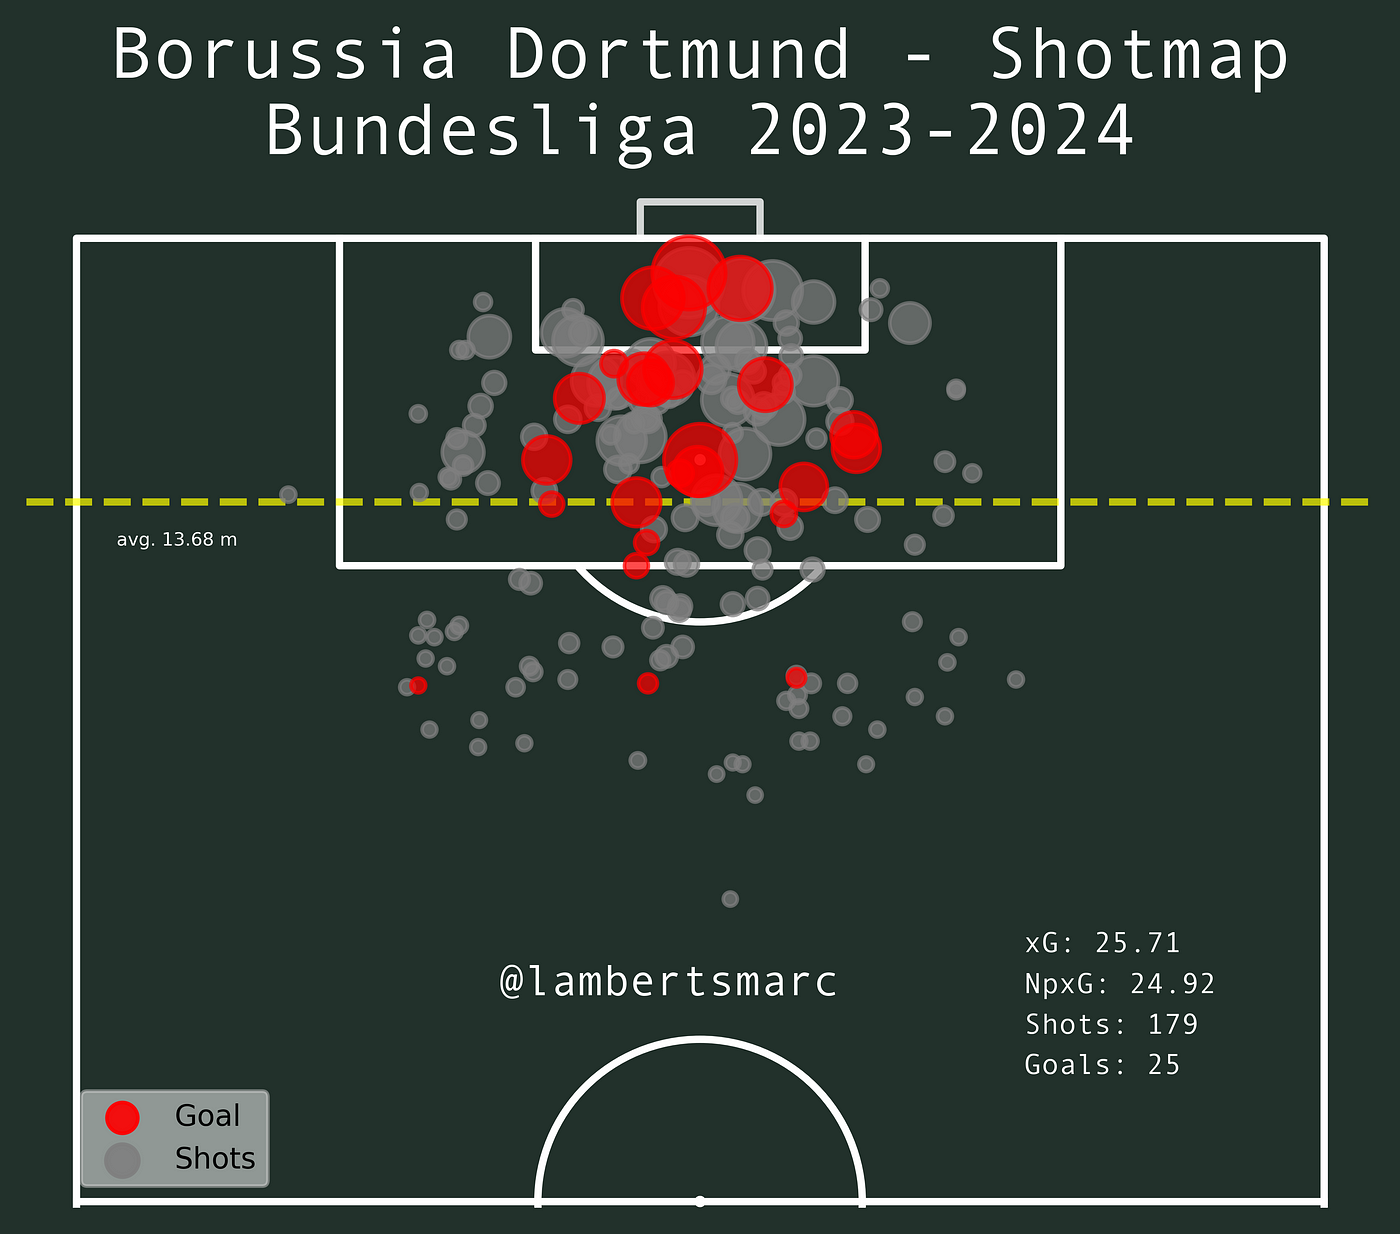
In the shotmap above you can see a few different things. First of all we see that Borussia Dortmund have scored 25 goals from 25,71 xG and a non-penalty xG of 24,92. This means that they are slightly underperforming with 0,71 — but such a small difference can be neglected.
We can also see that the average distance of shots is 13,68 meters and that the majority of the shots are done in the penalty area — closer to the goal than to the outside lines of that particular area.
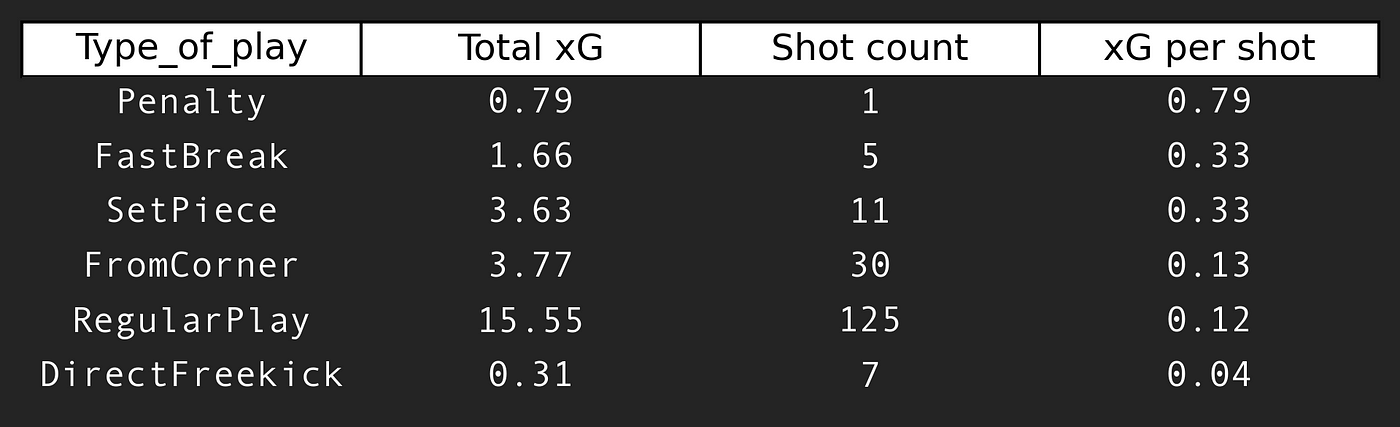
So how is the xG divided? We can see that 15,55 of that xG comes from regular play and has a corresponding xG per shot of 0,13. Then we can look at the different categories of set pieces, and see that they account for 3,63 + 3,77 + 0,31 + 0,79 xG. Which is 8,5 xG. The only thing left is counter-attacks or fast breaks, where Borussia Dortmund has generated 1,66 xG from shots with an xG per shot of 0,33.
Final thoughts
This analysis is very specific and only focuses on how Borussia Dortmund’s attacking threat is generated: expected threat and expected goals. We can conclude two different things:
- Borussia Dortmund are not underperforming or overperforming their expected goals if we look at a season level, but the fact that they had three games in succession without a positive expected goal difference can be seen as a worrying sign. Especially since some of the positive expected goal differences are very slim.
- Borussia Dortmund emphasise the wide areas in their passing, as those are their most common passing clusters, both in possession of the ball in their half, as well as in the opposition’s half. That overreliance can become repetitive and easier to spot for the opposition.
Did it confirm or deny my conceptions about this team? Not really. But the data and visualisations give me the idea that while it’s not very negative in the eyes of BVB, it’s very easy to slip into a negative pattern. There is not much fat in the meat and that’s dangerous.
Most of all this was an exercise to see what attacking expecting metrics can mean in terms of analysing teams. The context is so, so important and just a little difference in context can mean different results.