I was thinking the other day that developing metrics is completely based on bias because the creator of said metric has particular intentions with it. That made me think about whether I should publish my thoughts on a new metric I developed. Not because I think it’s bad, but because it might not be useful to everyone and I don’t want to be portraying some flawed metric as gospel.
After a while I realised that is not always about the end product, but more about the process. My thought process can be useful to myself and to others, whether they use this metric or develop their own. So, here I am and I’m going to talk about a new metric today: Proactive vs Reactive Defensive score.
Lees meer: Proactive vs Reactive defence score: Measuring in what way defenders like to engage in defensive activitiesContents
- Data
- Why this metric?
- How to calculate it
- How to use it
- Example I: WS:
- Example II: La Liga
- Conclusions
Data
The data I’m using for this metric is Wyscout data, but you can also build this with other data providers because they all register some sort of tackles and interceptions in their metrics. This is pivotal for these metrics, and I will explain later in the part of “How to calculate it”.
The data was collected from Wyscout on May, 17th 2024 and I have collected over 100 leagues, but the ones I’m going to work with are the following leagues:
– WSL 2023/2024 (Women)
– La Liga 2023/2024 (Men)
Important is that I filter for defensive players (defenders + midfielders) as it will help me assess pure defensive actions rather than pressing actions. I can’t 100% include/exclude these events, but the likelihood will be higher this way.
How to calculate it
First of all, you need to have all the defensive actions that are available. And, for this, you will need all the actions and not the successful actions. It’s about intent and not about concrete performance. All metrics I’m using are per 90 and are not adjusted for position.
I’ve added them all up so I get a total number of defensive actions:
– Aerial duels
– Defensive duels
– Shots blocked
– Interceptions
– Sliding tackles
This becomes a new metric, the total defensive actions per 90. What I do next is that I want to calculate two scores that give an idea of how many of those total actions are proactive or reactive:
# Calculate the Proactive defensive score as interceptions % of the total defensive actions
df[‘proactive_defensive_score’] = df[‘Interceptions per 90′] / df[’total_defensive_actions’]
# Calculate the Reactive defensive score as sliding tackles % of the total defensive actions
df[‘reactive_defensive_score’] = df[‘Sliding tackles per 90′] / df[’total_defensive_actions’]
I’ve calculated this above in Python — if you want the full code for this, subscribe to my Patreon for the full article + code + database — and calculate the scores for proactive defensive scores and for reactive defensive scores.
The final step is to make a ratio. You will have to compare both scores we have calculated above, to each other to assess a player’s defensive action performance. In other words, finding a scale where the score 50 is completely in balance, 0 is the most reactive defensive player and 100 is the most proactive player.
So in the end, you will have scores from 0–100 on the Proactivity-Reactivity scale.
How to use it
This scale is calculated for every player in your database and will be calculated in relation to the whole database.
This metric gives you an idea of intention. If you want to select/scout a player who’s more proactive in his actions and progresses the ball forward via an interception action, this scale can be useful in assessing that. But, also in the case of the defensive player being a more no-nonsense player in defence, this scale can help you in assessing this through data.
Like with any data metric, it’s of great importance to create more context into your tasks. I am of the opinion that data is incredibly useful, but without any context — it’s practically useless.
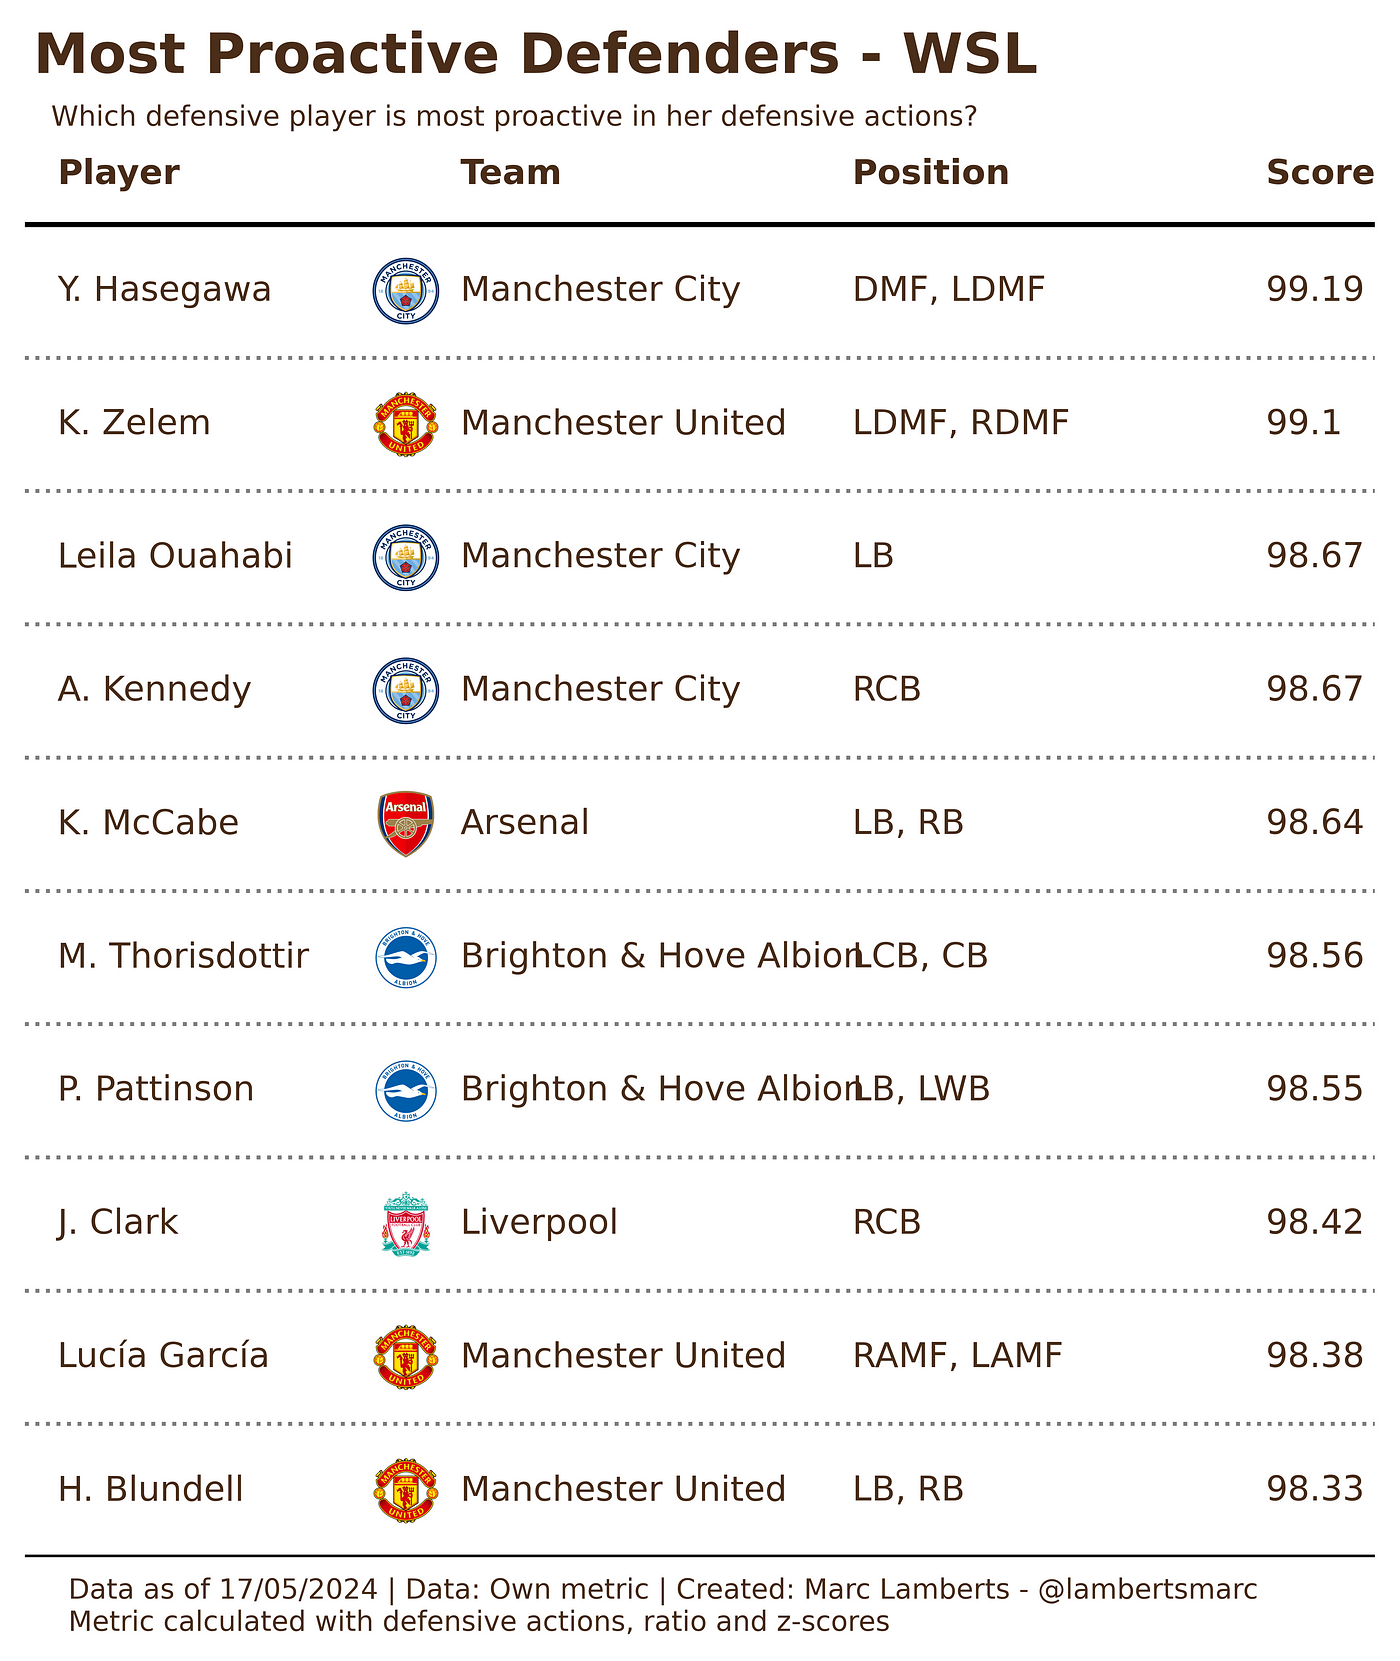
Example I: WSL — England

In the table above you can see an example of how we can look for the most proactive player in the WSL. We are looking for the scores closest to 100 and by doing so we find the top 10 of players who are the most proactive in their defence.
As we can see we see the most proactive defensive players in both Manchester sides: Manchester City and Manchester United. They look to ask the proactivity of their defensive players.
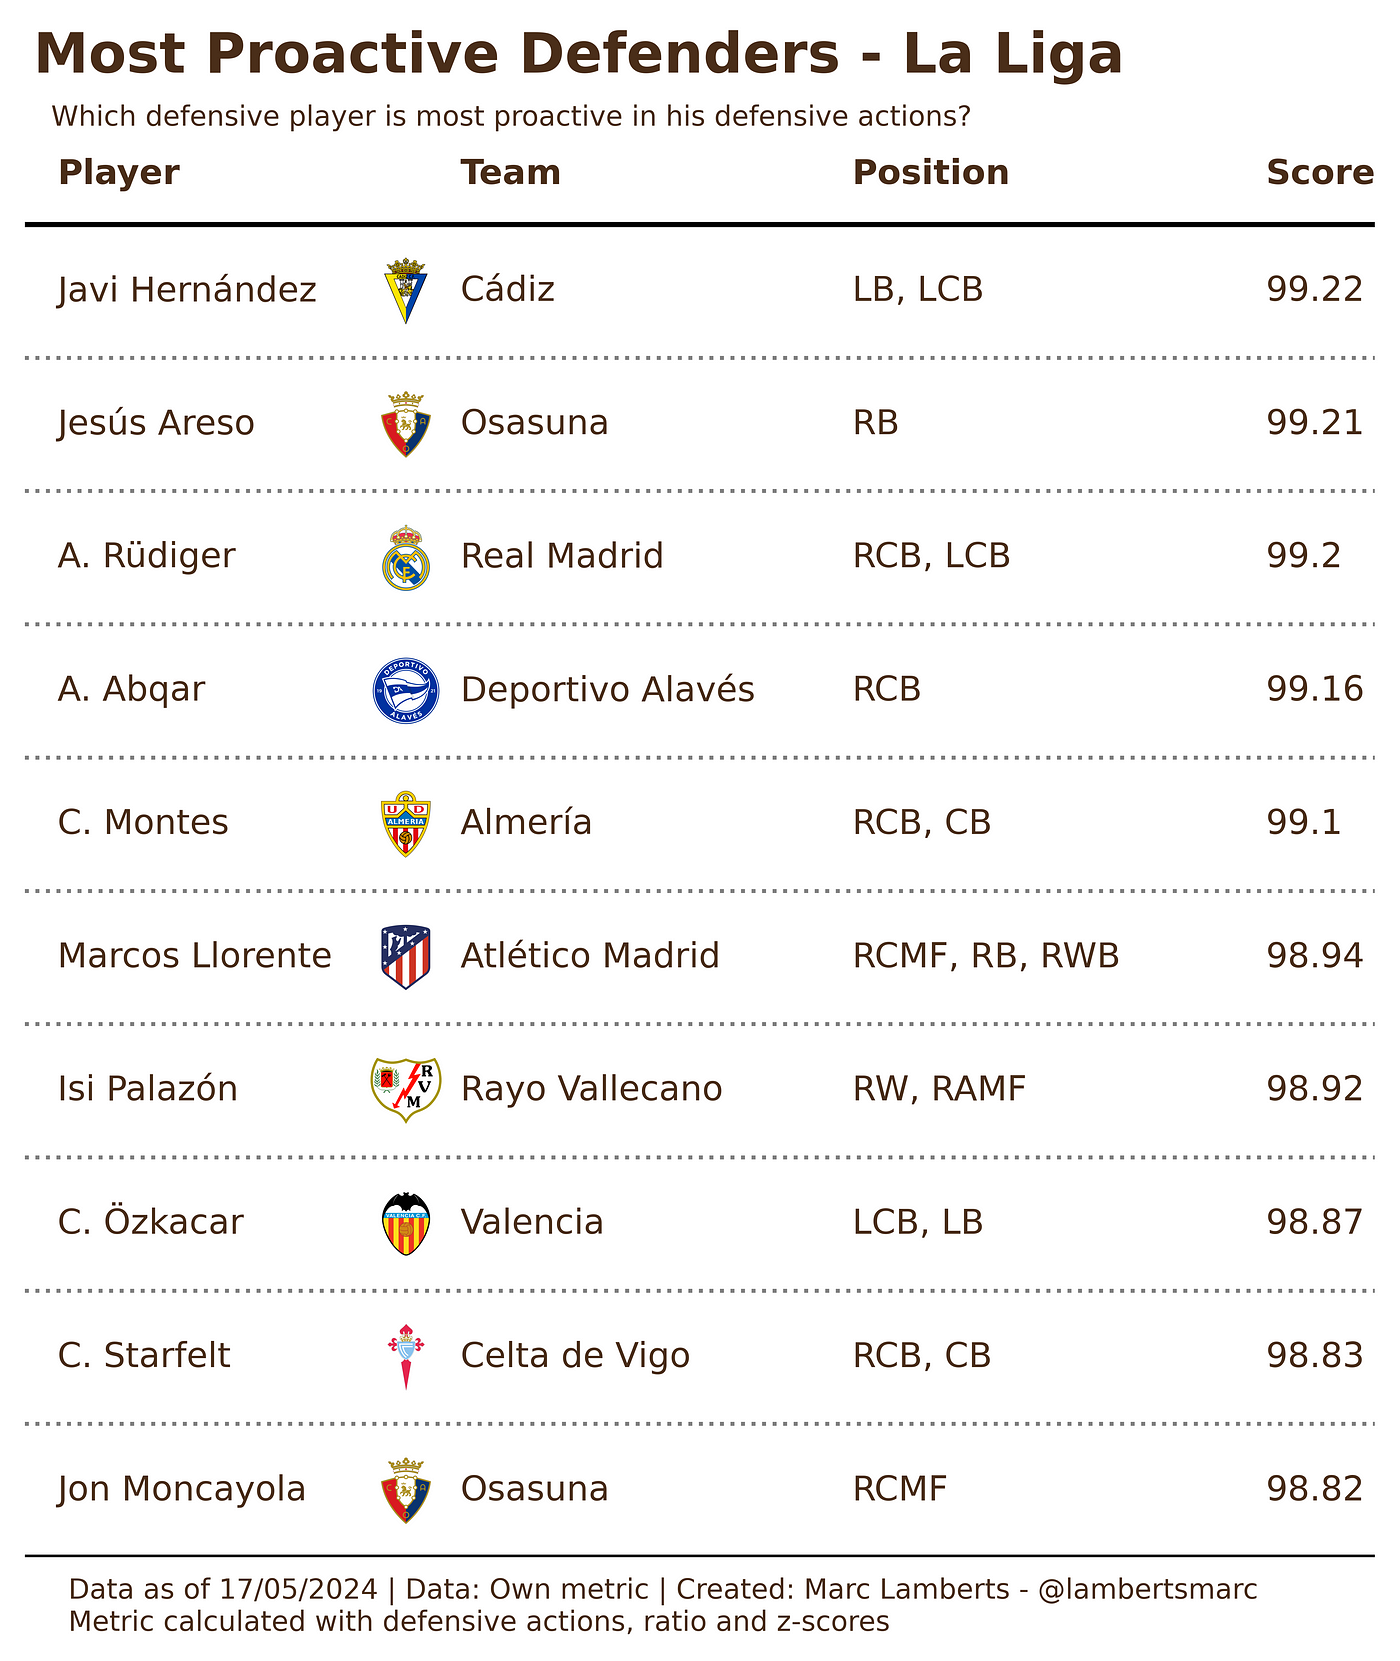
Example I: La Liga — Spain

In the table above you can see an example of how we can look for the most proactive player in La Liga. We are looking for the scores closest to 100 and by doing so we find the top 10 of players who are the most proactive in their defence.
As we can see we see most proactive defensive players comes from Osasuna, the rest are evenly divided with 1 player.
Conclusions
Looking into this metric and working with some thoughts have crossed my mind. First of all, it’s not waterproof and has a lot of work to be done for version 2.0.
Secondly, it’s difficult to assess whether an action is made in defence or as a pressing action, which can have different outcomes for the progression of the game.
Relating it to all defensive actions per 90 can lead to different results, because not every player is involved in the number of defensive actions nor does it necessarily say something about their quality.
All in all, these are things I need to look more closely at for the update on this metric so that it proves to be more trustworthy for day to day use.
For the full code and database, you can subscribe to my Patreon here: https://www.patreon.com/outswingerfc

Geef een reactie