Proactive vs Reactive defence score: Measuring in what way defenders like to engage in defensive activities

I was thinking the other day that developing metrics is completely based on bias because the creator of said metric has particular intentions with it. That made me think about whether I should publish my thoughts on a new metric I developed. Not because I think it’s bad, but because it might not be useful to everyone and I don’t want to be portraying some flawed metric as gospel.

After a while I realised that is not always about the end product, but more about the process. My thought process can be useful to myself and to others, whether they use this metric or develop their own. So, here I am and I’m going to talk about a new metric today:Ā Proactive vs Reactive Defensive score.

Lees verder: Proactive vs Reactive defence score: Measuring in what way defenders like to engage in defensive activities

Contents

  1. Data
  2. Why this metric?
  3. How to calculate it
  4. How to use it
  5. Example I: WS:
  6. Example II: La Liga
  7. Conclusions

Data

The data I’m using for this metric is Wyscout data, but you can also build this with other data providers because they all register some sort of tackles and interceptions in their metrics. This is pivotal for these metrics, and I will explain later in the part of ā€œHow to calculate itā€.

The data was collected from Wyscout on May, 17th 2024 and I have collected over 100 leagues, but the ones I’m going to work with are the following leagues:
– WSL 2023/2024 (Women)
– La Liga 2023/2024 (Men)

Important is that I filter for defensive players (defenders + midfielders) as it will help me assess pure defensive actions rather than pressing actions. I can’t 100% include/exclude these events, but the likelihood will be higher this way.

How to calculate it

First of all, you need to have all the defensive actions that are available. And, for this, you will need all the actions and not the successful actions. It’s about intent and not about concrete performance. All metrics I’m using are per 90 and are not adjusted for position.

I’ve added them all up so I get a total number of defensive actions:
– Aerial duels
– Defensive duels
– Shots blocked
– Interceptions
– Sliding tackles

This becomes a new metric, the total defensive actions per 90. What I do next is that I want to calculate two scores that give an idea of how many of those total actions areĀ proactiveĀ orĀ reactive:

# Calculate the Proactive defensive score as interceptions % of the total defensive actions
df[‘proactive_defensive_score’] = df[‘Interceptions per 90′] / df[’total_defensive_actions’]

# Calculate the Reactive defensive score as sliding tackles % of the total defensive actions
df[‘reactive_defensive_score’] = df[‘Sliding tackles per 90′] / df[’total_defensive_actions’]

I’ve calculated this above in Python — if you want the full code for this, subscribe to my Patreon for the full article + code + database — and calculate the scores for proactive defensive scores and for reactive defensive scores.

The final step is to make a ratio. You will have to compare both scores we have calculated above, to each other to assess a player’s defensive action performance. In other words, finding a scale where the score 50 is completely in balance, 0 is the most reactive defensive player and 100 is the most proactive player.

So in the end, you will have scores from 0–100 on the Proactivity-Reactivity scale.

How to use it

This scale is calculated for every player in your database and will be calculated in relation to the whole database.

This metric gives you an idea of intention. If you want to select/scout a player who’s more proactive in his actions and progresses the ball forward via an interception action, this scale can be useful in assessing that. But, also in the case of the defensive player being a more no-nonsense player in defence, this scale can help you in assessing this through data.

Like with any data metric, it’s of great importance to create more context into your tasks. I am of the opinion that data is incredibly useful, but without any context — it’s practically useless.

Example I: WSL — England

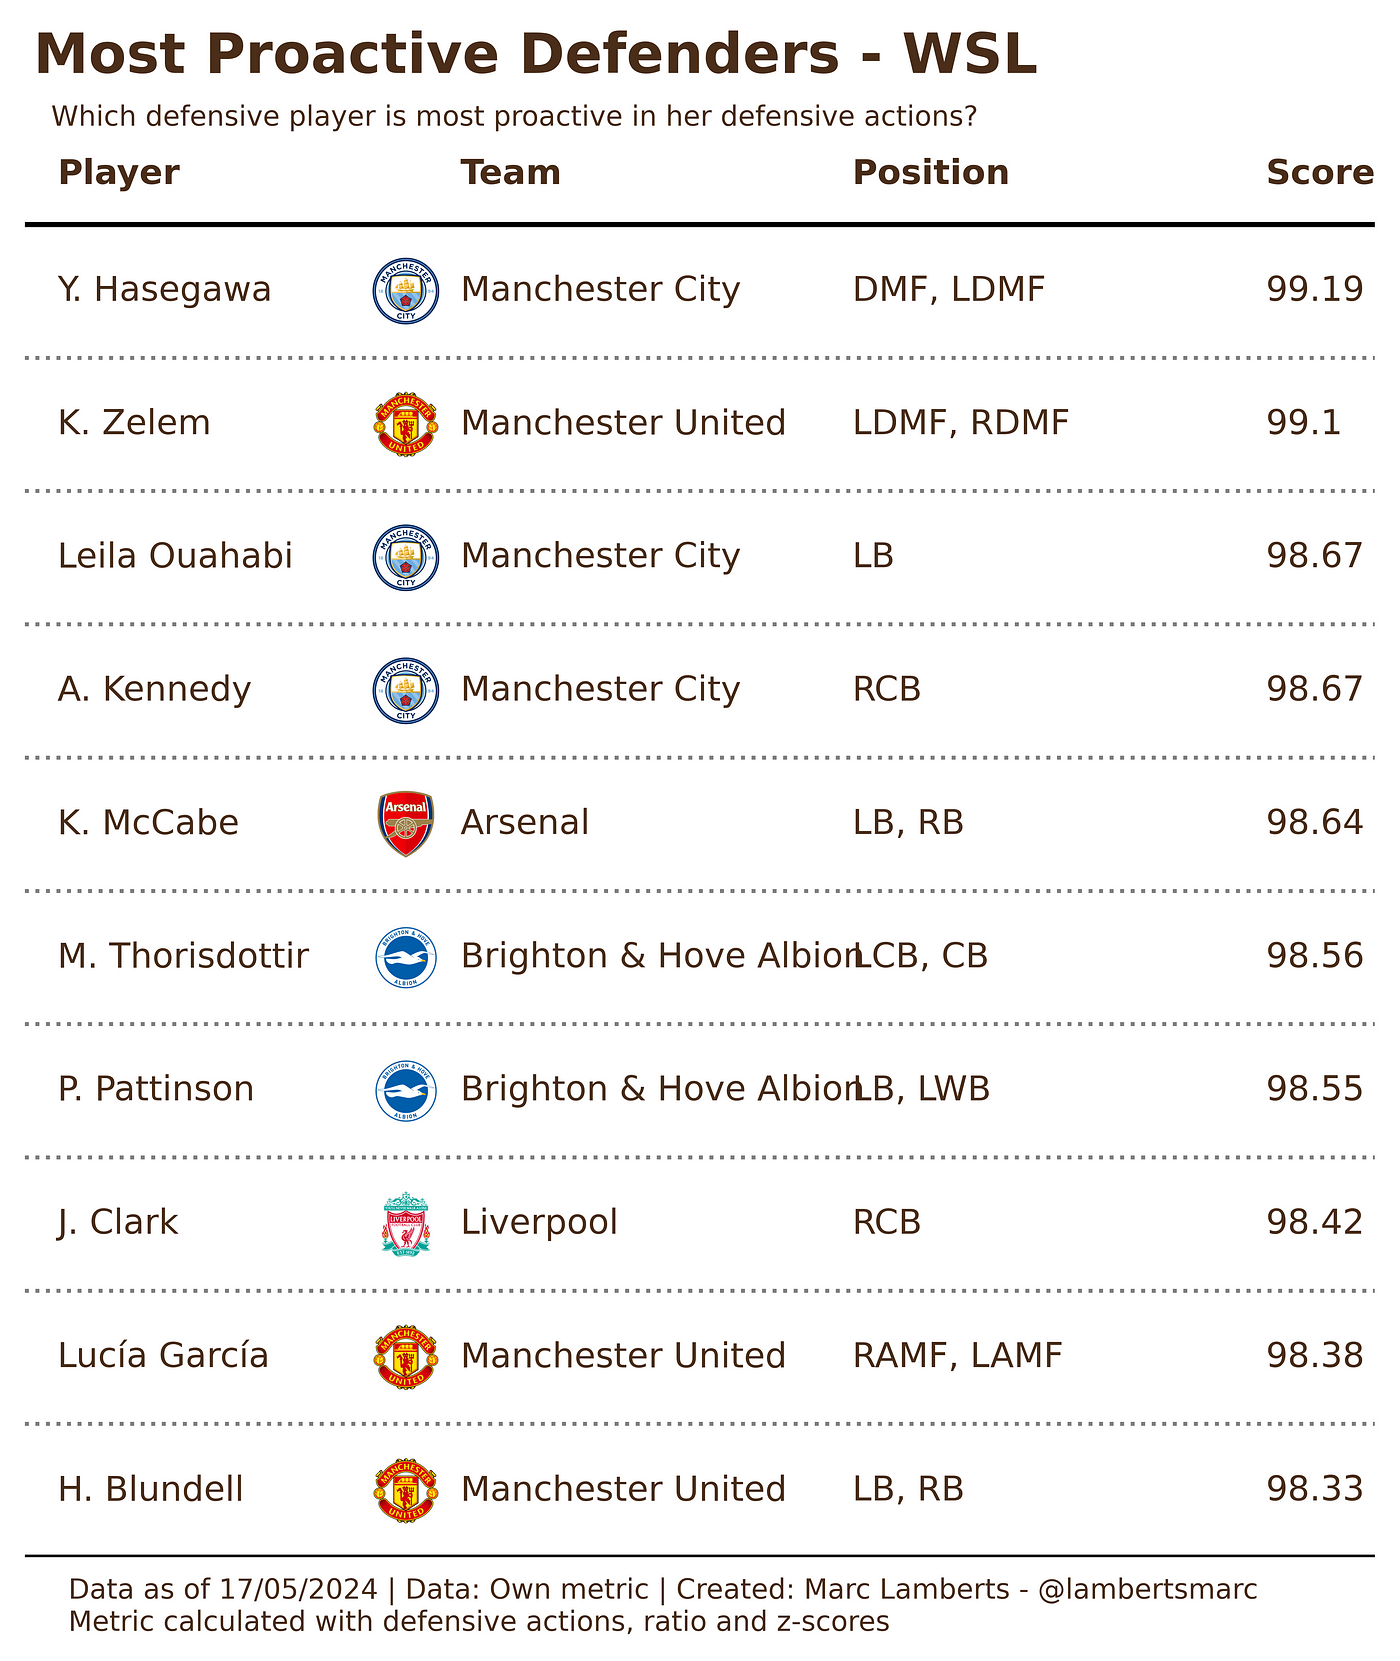
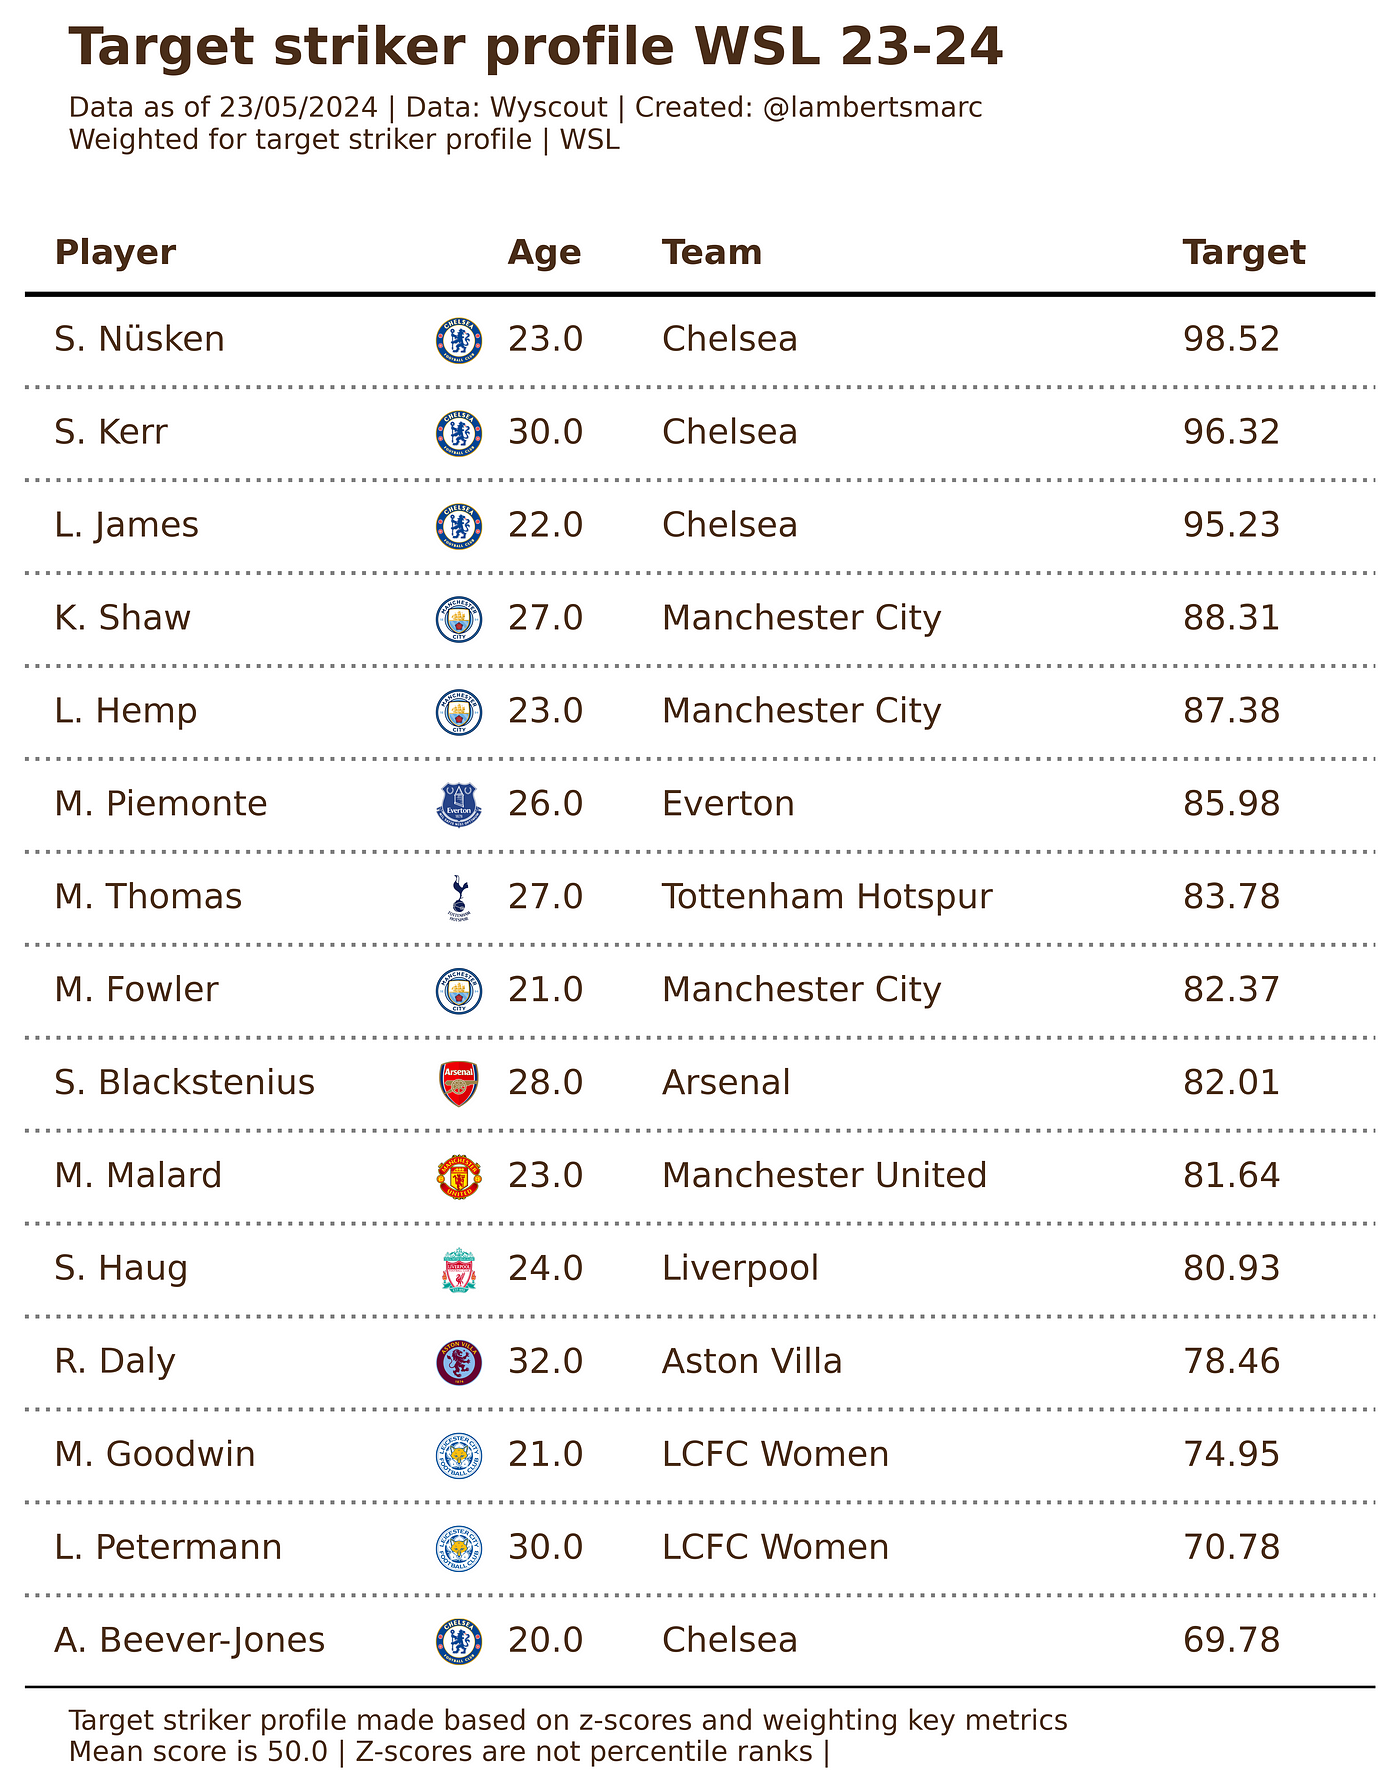
In the table above you can see an example of how we can look for the most proactive player in the WSL. We are looking for the scores closest to 100 and by doing so we find the top 10 of players who are the most proactive in their defence.

As we can see we see the most proactive defensive players in both Manchester sides: Manchester City and Manchester United. They look to ask the proactivity of their defensive players.

Example I: La Liga — Spain

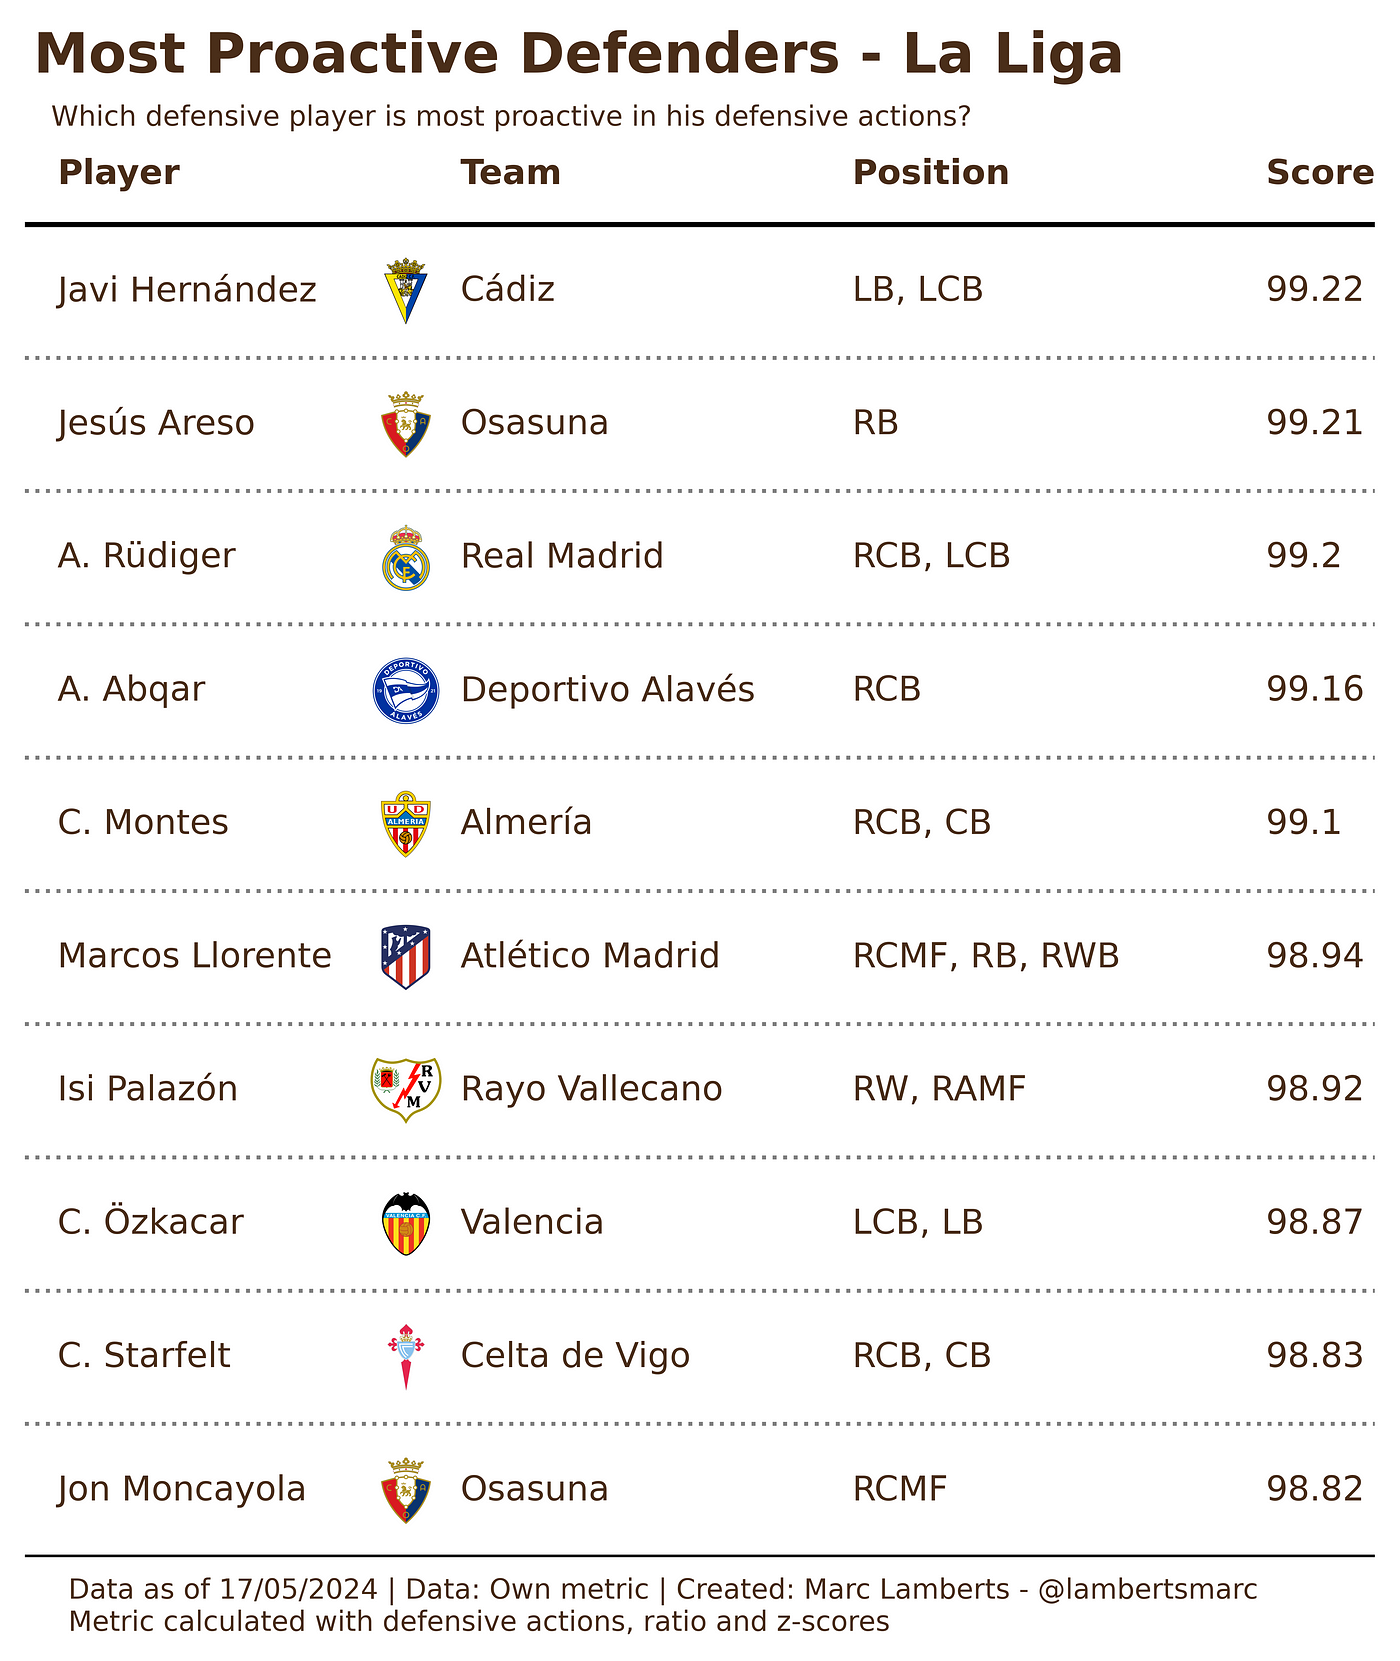
In the table above you can see an example of how we can look for the most proactive player in La Liga. We are looking for the scores closest to 100 and by doing so we find the top 10 of players who are the most proactive in their defence.

As we can see we see most proactive defensive players comes from Osasuna, the rest are evenly divided with 1 player.

Conclusions

Looking into this metric and working with some thoughts have crossed my mind. First of all, it’s not waterproof and has a lot of work to be done for version 2.0.

Secondly, it’s difficult to assess whether an action is made in defence or as a pressing action, which can have different outcomes for the progression of the game.

Relating it to all defensive actions per 90 can lead to different results, because not every player is involved in the number of defensive actions nor does it necessarily say something about their quality.

All in all, these are things I need to look more closely at for the update on this metric so that it proves to be more trustworthy for day to day use.

For the full code and database, you can subscribe to my Patreon here: https://www.patreon.com/outswingerfc

Stina Blackstenius — Scout report 2023/2024

Do you ever look at a player and think: I don’t exactly know what to make of you? That’s what I have with Stina Blackstenius and her period at Arsenal. She is a good player, but how impactful is she? That’s something I will try to find out using data in this article.

Read more: Stina Blackstenius — Scout report 2023/2024

It’s good to know that a few years back ahead of her move to Arsenal I had a look at her record in Damallsvenskan and you can read that here:

We will use data and video to illustrate how Blackstenius has done in the WSL 2022/2023 and we will focus on the striker position.

Contents

  1. Biography
  2. Seasonal stats
  3. Positions/roles
  4. Ball progression
  5. Dribbling
  6. Key passing
  7. Shooting
  8. Assisting
  9. Expected goal contribution
  10. Comparison with peers
  11. Final thoughts

Biography

  • Name: Stina Blackstenius
  • Date of birth: 05–02–1996
  • Nationality: Swedish
  • Position: Striker
  • Contract expires: 30–6–2026
  • Current club: Arsenal
  • Previous clubs: Vadstena GIF(Y), Vadstena, Linkƶping FC, Montpellier, Linkƶping FC, Gƶteborg FC, BK HƤcken, Arsenal
  • International: Sweden (107 games, 31 goals)
  • Marketvalue Soccerdonna: €185.000

The question is when we look at Blacktenius: what profile does she have? She is good at scoring goals and providing assists. She is good in the air and can link up pretty well. These things might suggest she could do a fantastic job as a striker.

We see her as a classical striker, but she can do much more on the pitch. Not only is she good at the goalscoring aspect of the game, but can also hold the ball very well, win aerial duels and can be used as a decoy in certain set plays. She could be more versatile than we think, and that’s the reason that we are looking at her today.

Seasonal stats

Data from Opta — all attackers included

If we look at this specific pizza plot, we can say a few things. But before we turn into the meaning, it’s good to stress that this mostly gives us a stylistic idea of the player rather than a definitive performance one. It’s also a general template used for all players, so it just gives us an indication.

What we can see is in the attacking metrics is that she scores well in the shooting metrics compared to her peers, but not great at the assists metrics and the shot-creating metric. This can explained as someone who is at the end of an attack, and not so much at the start of it.

In terms of the passing data, she does perform on average scoring low on the number of passes, the progressive passes and the dribbles. and higher on the progressive passes received, progressive carries and the touches in the final third. This can also be expected due to her position.

The defending metrics, aren’t something you should pay too much attention to if you would like to rate her overall, but one metric we will pay close attention to is the aerial duels won — this means that she is doing above average well in the air and when in defensive mode, she can clear a lot of balls. A valuable quality to have when you are defending set pieces for example.

Data from Wyscout — compared to Forwards + Attacking midfielders.

Here you can see the more complete radar percentile ranks on the left, as you can see Blackstenius scores very differently in the different aspects, but in general, we can conclude: that she scores very high in the shooting metrics in green, is great in aerial duels, but scores quite average on anything else.

On the right you can see the same information, how she scores compared to her peers, but this time you see it in a different visual + the actual raw data is included as well.

Positions/roles

In terms of positions, there is not a lot of variety in where she plays. She plays as the striker in the different formations that Arsenal plays: 4–2–3–1 (81%) and 4–4–2 (9%) and others. The point is not to say Arsenal play this way and this way, but to emphasise that she can play as the sole striker, in a two or as the striker interacting with the wingers.

The more interesting question is what role she can play in an attack. There are four different roles in the attack, but only two are relevant: Target striker and goalscoring striker.

Here we took the data and put emphasis and weight on the key metrics for both roles. What’s interesting is that Blackstenius is in the top 15 of the target striker role according to z-scores, but for the goalscoring role — for what we mainly praise her — according to the data she has a score of 82,01 — which is means she closer to being a perfect fit to the role rather than to the mean score..

Now, what happens if we compare her to a goalscoring profile vs her peers?

Blackstenius scores 11th of all strikers if we look at the goalscoring role. While Blackstenius scores incredibly high in the shooting and xG metrics, her fit for a goalscoring striker isn’t 100% — which means that she is more versatile than thought before, which explains the 80,32% role fit.

Ball progression

The modern striker isn’t only concerned with dribbling and crosses — but he/she also needs to be comfortable on the ball and progress play from it.

In the scatterplot above you can see the progressive metrics of progressive passes per 90 and progressive runs per 90. Blackstenius doesn’t do well here as she scores below average in the progressive passes metric, and below average in the progressive runs metric. Most strikers are doing better than her per 90 minutes.

Dribbling

How good is Stina Blackstenius in her dribbling? Let’s find out in this scatterplot below:

In the scatterplot above you can see how well the player is scoring in terms of volume of dribbling and the success rate of those dribbles. As you can see Blackstenius heavily underperforms in both metrics again. But what does the context give us?

https://cdn.embedly.com/widgets/media.html?src=https%3A%2F%2Fplayer.vimeo.com%2Fvideo%2F950497376%3Fapp_id%3D122963&dntp=1&display_name=Vimeo&url=https%3A%2F%2Fvimeo.com%2F950497376&image=https%3A%2F%2Fi.vimeocdn.com%2Fvideo%2F1859061930-ffce006f2aafd9491f21a9c806313b1f6f35cdce50a0ae4346f2a79563bb6cd1-d_1280&key=a19fcc184b9711e1b4764040d3dc5c07&type=text%2Fhtml&schema=vimeo

As you can see in the example above, Blackstenius struggles with the ball on her feet in relation to dribbling. Her close control isn’t as good that the defenders can be lost to her advantage. In fact, the defenders have the advantage over her and therefore her success rate is also significantly lower than some of her peers.

Key passing

Every player makes passes in a game, but which passes actively contribute to the progression and construction of an attack? You can see that in the bar graph below regarding key passes

As you can see in the graph above, Blackstenius scores very low in comparison to her peers in terms of key passing. If we look more closely she only is on average for key passes, through passes and deep completions. Despite not scoring high. the intent of her through passes does tell a lot about how she can help in an attack.

https://cdn.embedly.com/widgets/media.html?src=https%3A%2F%2Fplayer.vimeo.com%2Fvideo%2F950501635%3Fapp_id%3D122963&dntp=1&display_name=Vimeo&url=https%3A%2F%2Fvimeo.com%2F950501635&image=https%3A%2F%2Fi.vimeocdn.com%2Fvideo%2F1859069548-a020874598720ed3f0a6467ae7fa10d36885146f937e597a9f5ddaa91d442464-d_1280&key=a19fcc184b9711e1b4764040d3dc5c07&type=text%2Fhtml&schema=vimeo

Blackstenius has a good technique to pass the ball and that also can be seen in the way she conducts her key passes, through passes in particular. She positions herself well, but there’s one thing that she really can work and it’s to give the right pace and weight on the passes. That will be the key to success.

Shooting

https://cdn.embedly.com/widgets/media.html?src=https%3A%2F%2Fplayer.vimeo.com%2Fvideo%2F950503855%3Fapp_id%3D122963&dntp=1&display_name=Vimeo&url=https%3A%2F%2Fvimeo.com%2F950503855&image=https%3A%2F%2Fi.vimeocdn.com%2Fvideo%2F1859073676-4622aa20a62a1b420cd78d0cc66243c78224f090d4564706c2cc3f6a568c53fa-d_1280&key=a19fcc184b9711e1b4764040d3dc5c07&type=text%2Fhtml&schema=vimeo

In the video above you can see all the goals scored by Stina Blackstenius with Arsenal in the 2023–2024 WSL season.

In the scatterplot above you can see the metrics of shots per 90 and expected goals per 90 combined. As you can Blackstenius scores above average for both metrics, with only Beever-Jones, James, Kelly and Shaw scoring better in the volume of shots and the xG generated, only Kerr, Russo, Beever-Jones and Shaw perform better.

When we look at the expected goals and the actual goals we see that she averages 0,62 xG per 90 and 0,77 goals per 90 — this means that she is overperforming on her xG.

Blackstenius does sometimes come in the position to shoot, but how does he do in the quality of shooting?

In the shot map above you can see from where Blackstenius has conducted her shots in the 2023/2024 WSL season. She had 41 shots of which 7went in goal. 34,1% of her shots were on target and she generated a total xG of 8,19 — the latter meaning that she is overperforming with +1,19.

Assists

https://cdn.embedly.com/widgets/media.html?src=https%3A%2F%2Fplayer.vimeo.com%2Fvideo%2F950507063%3Fapp_id%3D122963&dntp=1&display_name=Vimeo&url=https%3A%2F%2Fvimeo.com%2F950507063&image=https%3A%2F%2Fi.vimeocdn.com%2Fvideo%2F1859078847-dafc4ff5f56c62259edab2874b93e7615a587d3bc9047f0b670428a92edc0d9e-d_1280&key=a19fcc184b9711e1b4764040d3dc5c07&type=text%2Fhtml&schema=vimeo

In the video above you can see her latest assists over two seasons with the Swedish National Team and with Arsenal.

As you can see she has an expected assists number of 0,11 per 90 and while others do score better on that front, she has an actual assist number of 0,0004 per 90 — which means he is underperforming quite significantly per 90 minutes.

Expected goal contributions

If we look at the expected goal contributions per 90 minutes we can see something very interesting. Blackstenius is expected to contribute to roughly 0,73 goals per 90 minutes. The emphasis for this, however, is on her finishing — as she isn’t doing well in the creating part.

Comparisons

Final thoughts

Stina Blackstenius was a bit of a mystery to me as I didn’t know how to rate her in terms of her performance. When we look more closely to the data we can see that’s a world-class striker of the ball and is top in the shooting metrics. In the ball progression and creation metrics, she scores below average in comparison to her peers.

In conclusion, we can state that Blackstenius is that pure number 9 and that Arsenal need to work with her in that regard.

Goalkeeper Sweeper Pass Score: Measuring how a sweeping action can contribute to progression

It’s been a few months now since I’ve started looking at data at a different way. Instead of focusing on the metrics that are generated, I’ve been looking at the raw data more and create my own metrics. Part of the reason of that is that I’m never completely satisfied with the metrics given by the different data providers. Especially, when it comes to goalkeeper’s data.

Continue reading “Goalkeeper Sweeper Pass Score: Measuring how a sweeping action can contribute to progression”

Using Standard Deviation and Mean Absolute Deviation to rate Goalkeeper’s shot-stopping

For the last few years I’ve been dabbling with data in football, especially with data visuals that show performance or intention. For the most part I have only focused on that was familiar within the data and focused on representation of data and the manipulation of it. But since I’ve worked more and more with data in big datasets, I’ve also realised that differences in outcome also have a lot to do with the methodology you are using.

Continue reading “Using Standard Deviation and Mean Absolute Deviation to rate Goalkeeper’s shot-stopping”

Gamestate xG Score: Expected goals adjusted by game state

Expected goals. You might thinkĀ oh no here we go again, but I think it might be the one metric that has become part of normal conversations, without actually knowing the power or versatility of it. That also means we often talk about expected goals or xG and make wrong assumptions/conclusions. This can lead to a completely distorted point of view and discredit the work data people do in sports.

read more

Free kick Threat Score: Measuring the threat a player generates from indirect free kicks

For me, 2024 is going to be more about creating and applying existing data metrics across football. The first genre of metrics is the metrics that are useful for set pieces because I feel that’s where a lot of improvement can be made and also because I’m just a nerd for set pieces.

Read more

Lauren James — Scout report 2023/2024

Chelsea is home to an exceptionally talented player who has surprisingly remained under the radar in terms of media attention. This player is none other than Lauren James, whose performance in the 2023–2024 WSL season has been noteworthy. Despite her significant contributions to the team, especially in terms of assists and goals, her achievements have not been widely recognised as she deserves.

Read more

Corner Threat Score: Measuring the threat a player generates from taking inswinging and outswinging corners

In football, there are many things to look at from a tactical or coaching perspective and a data perspective. One of the things I love looking at are set pieces, corners in particular. There are not many corner-specific metrics out there and the available ones, mostly focus on the result of the corner in terms of expected goals (xG). In this article, I will explain the new data metric that I have created: Corner Threat Score (CTS), which is divided into Corner Threat Score Inswingers (CTSI) and Corner Threat Score Outswingers (CTSO).

read more

SCOUT REPORT – CODY GAKPO

The Eredivisie. The Dutch top tier has been either creating or developing talent, that later go on to play in the top 5 leagues in Europe. Obviously, there are many examples of these success stories, for Dutch plays and foreign players, but that’s not exactly what I’m writing about in this piece. I want to have a closer look at PSV golden boy: Cody Gakpo.

PSV has a history with exciting talent up front, with the most talented players being Memphis (Barcelona) and Bergwijn (Tottenham Hotspurs). It’s not unlikely that Cody Gakpo will be the next export product that will impress people abroad. Now, he has signed a new contract just a few days ago – but that doesn’t mean that come summer, the big boys in Europe won’t be waving with their bags of Euros.

Biography

Cody Gakpo was born on May 7th, 1999 in Eindhoven and is a local boy. The 22-year old attacker can play as a winger, as well as the striker, but he is at his best when he plays on the left flank and can invert. After which he uses his right foot to dictate play and choose a corner of the goal to shoot.

He started to play for EVV Eindhoven AV before starting in the PSV academy in 2007 until 2018. In 2018 he made the step from the academy to the first team and hasn’t been out of the picture since.

Data

In this article, I will use data, which comes from different sources. Most of the data comes from Wyscout and some will be from Soccerment. In my database from Wyscout I have included every player that is either a winger or a striker and they are from the following leagues: Eredivisie (NL), Jupiler Pro League (BE), Bundesliga (AUT), Primeira Liga (POR) & Premiership (SCO). I have selected all these leagues, as they have a similar range of quality.

There are 270 players in my database and they have been selected through their minimal amount of minutes played in the domestic league they play in. The minimum amount of minutes is 600. Normally I would pick 900 minutes as the benchmark, but since the season is still ongoing, I decided 600 was sufficient.

In the radar plot above you can see how Cody Gakpo scores in relation to the average of his peers in the leagues mentioned. He scores way above average in every single metric, except the head goals per 90 metrics. It’s fair to say that not many excel at head goals, but he hasn’t scored with his head – so that’s something he might need to work on.

So we have already seen that he does well above average, but how does he rank in the percentiles? In the image above you can see in which percentile he ranks for every attacking metric that we chose to look at it. In most of the metrics, he scores in the 80th percentile or up.

Shooting

In the image above you can see a scatterplot that contains two different metrics: shots per 90 and expected goals per 90. As you can see Gakpo does very well in the volume of shots. With his 3,51 shots per 90 he sits in the 96th percentile of all players in this database.

When we look to the other metrics, the expected goals per 90, we see that he does well – he is in the Q1 quarter, but not exceptional. With his 0,41 xG per 90, he sits in the 76th percentile. That’s good, but not exceptional.

As you can see I have marked Gakpo in green, and some Ajax players in red. I wanted to illustrate how well he does against their direct rivals for the title. Only Haller is way better, but his data is quite insane this season.

In the image above you can see a shot map of Cody Gakpo in the Eredivisie so far this season. In 14 games played he had a total of 45 shots in the Eredivisie, averaging 3,2 shots per game. Of those shots, he has scored 6 goals, which is a conversion rate of 13,33% according to Opta stats. According to Wyscout, he has an xG of 5,62 from 48 shots – which means he is overperforming his expected goals slightly with +0,38.

Creating

In the image above you see how good Gakpo is in the creating of direct goalscoring. We measure this in this article as expected assists 90 vs assists per 90. In the expected assists per 90, Gakpo has 0,38 xA per and sits in the 99th percentile.

When we look at the actual assists given per 90, we see that Gakpo does extremely well. He has 0,66 assists per 90 and sits in the 99th percentile for doing so.

As you can see I have marked Gakpo in green, and some Ajax players in red. I wanted to illustrate how well he does against their direct rivals for the title. Only Tadicy is way better, but his assist data is quite unique.

In the image above I have illustrated how well Gakpo does in the expected threat (xT) metric in this season’s Eredivisie. Before I look further into this, this is what xT is:

The basic idea behind xT is to divide the pitch into a grid, with each cell assigned a probability of an action initiated there to result in a goal in the next N actions. This approach allows us to value not only parts of the pitch from which scoring directly is more likely, but also those from which an assist is most likely to happen. Actions that move the ball, such as passes and dribbles (also referred to as ball carries), can then be valued based solely on their start and end points, by taking the difference in xT between the start and end cell. In the case of Grealish, his ball carry brought a 0.013 xT increase, and the pass added a further 0.26 xT. In short, he moved the ball from a low-xT cell (0.02 xT) to a much more dangerous area of the pitch (0.32 xT). Note that the xT action value can be negative for passes and carries that move the ball away from goal. ā€“ Soccerments

In short, how much does Gakpo contribute to the expected threat of a sequence of actions towards goal? If we look at the top 10 players of this season we see that Gakpo scores 8th. When we look at the expected threats by carries, we can see that he ranks second with 1,24 xT just after Elayis Tavsan with 1,35 xT.

Dribbling

In the image above you see how good Gakpo is in the dribbling metrics. We measure this in this article as progressive runs per 90 vs dribbles per 90. In the progressive runs per 90, Gakpo has 2,93 progressive runs per 90 and sits in the 90th percentile.

When we look at the dribbles per 90, we see that Gakpo does extremely well. He has 8,56 dribbles per 90 and sits in the 97th percentile for doing so.

As you can see I have marked Gakpo in green, and some Ajax players in red. I wanted to illustrate how well he does against their direct rivals for the title. Only Anthony is slightly better, but Gakpo comes close to his numbers.

Final thoughts

When we look at the data for shooting, creating and dribbling – it’s evident that Cody Gakpo is an exciting player. He scores in the highest percentile for most of the metrics, and compared to 270 of his peers, he does extremely well. The next step is to see whether he fits the profile of an attacker needed by one of the big clubs, by looking at his videos.

A statistical analysis of Terzic’s Borussia Dortmund 2023/2024: Expected threat and Expected goals

The German Bundesliga is the highest tier in German football and while the most excitement can be found one tier below, the Bundesliga does have some fantastic narratives and stories. One of those narratives is that Borussia Dortmund should be the main contender for Bayern München, but with Terzic as head coach, there are so many things going very well and very wrong.

read more