

For me, 2024 is going to be more about creating and applying existing data metrics across football. The first genre of metrics is the metrics that are useful for set pieces because I feel that’s where a lot of improvement can be made and also because I’m just a nerd for set pieces.
Earlier this year, I already introduced Corner Threat Score . The Corner Threat Score is a metric that I’ve created to measure the threat of the delivery by the player taking the corner. It measures the threat of the cross/pass, the zone it arrives in, the possibility of direct contact resulting in a goal, and the swing of the corner being taken.
You can read all about it here:
So, the idea is quite similar for this new metric called Free kick Threat Score (FTS). How does the free kick taker generatethreat and how can we measure it the data at hands?
This article will be quite the same as the article on CTS, but with a few details that are different to make sure it’s clear what this metric means and how we can use it.
What is FTS?
The Free Kick Threat Score is a metric that I’ve created to measure the threat of the delivery by the player taking the free kick. It measures the threat of the cross/pass, the zone it arrives in, the possibility of direct contact resulting in a goal and the swing of the corner being taken.
The metric is a score that measures the threat on a scale from 0 to 100, and the higher the number the more danger you create concerning the other takers of free kicks in the specific database.
FTS is a combination of different data metrics and metrics that have to be created from event data to capture the threat that can be attributed to a delivery from a free kick.
An added qualification or filter is that we only look at indirect free kicks. We want to measure the danger of the delivery on which other players can convert, rather than the danger that comes from a shot — which we have xG for.
Why do we need FTS?
In set pieces, we have to rely mostly on the eye test, but just as in every aspect of the game — within the right context data metrics can be vital to a better analysis or performance. We mostly talk about the shots or defensive actions that are the result of the delivery, but not so often about the quality or threat from the delivery itself. So to analyse and reflect on the threat a kicktaker brings to the table, I’ve created this metric.
This metric will help in creating a more detailed analysis for free kick analysis and how to tweak them to get the most potential out of this particular set piece. In the professional elite game, the margins are very small and every little tweak can help with getting more advantage.
Data provider
The data used to create the metric is all from Opta. It’s not from FBRef, although it’s a very good source. The difference is that the data I use is all raw data and the data from FBREF comes from Opta, but is already fitted to specific metrics and that doesn’t work for me.
The data comes from the event data or x-y data that is from Opta, which is also called raw data. That is the starting point for everything in this data metric, because we are building this metric from scratch.

As you can see, this is the raw data that I’m going to use — however, this isn’t the complete file that I’m going to need. To get to the final data, I need to first calculate passes and progressive passes.
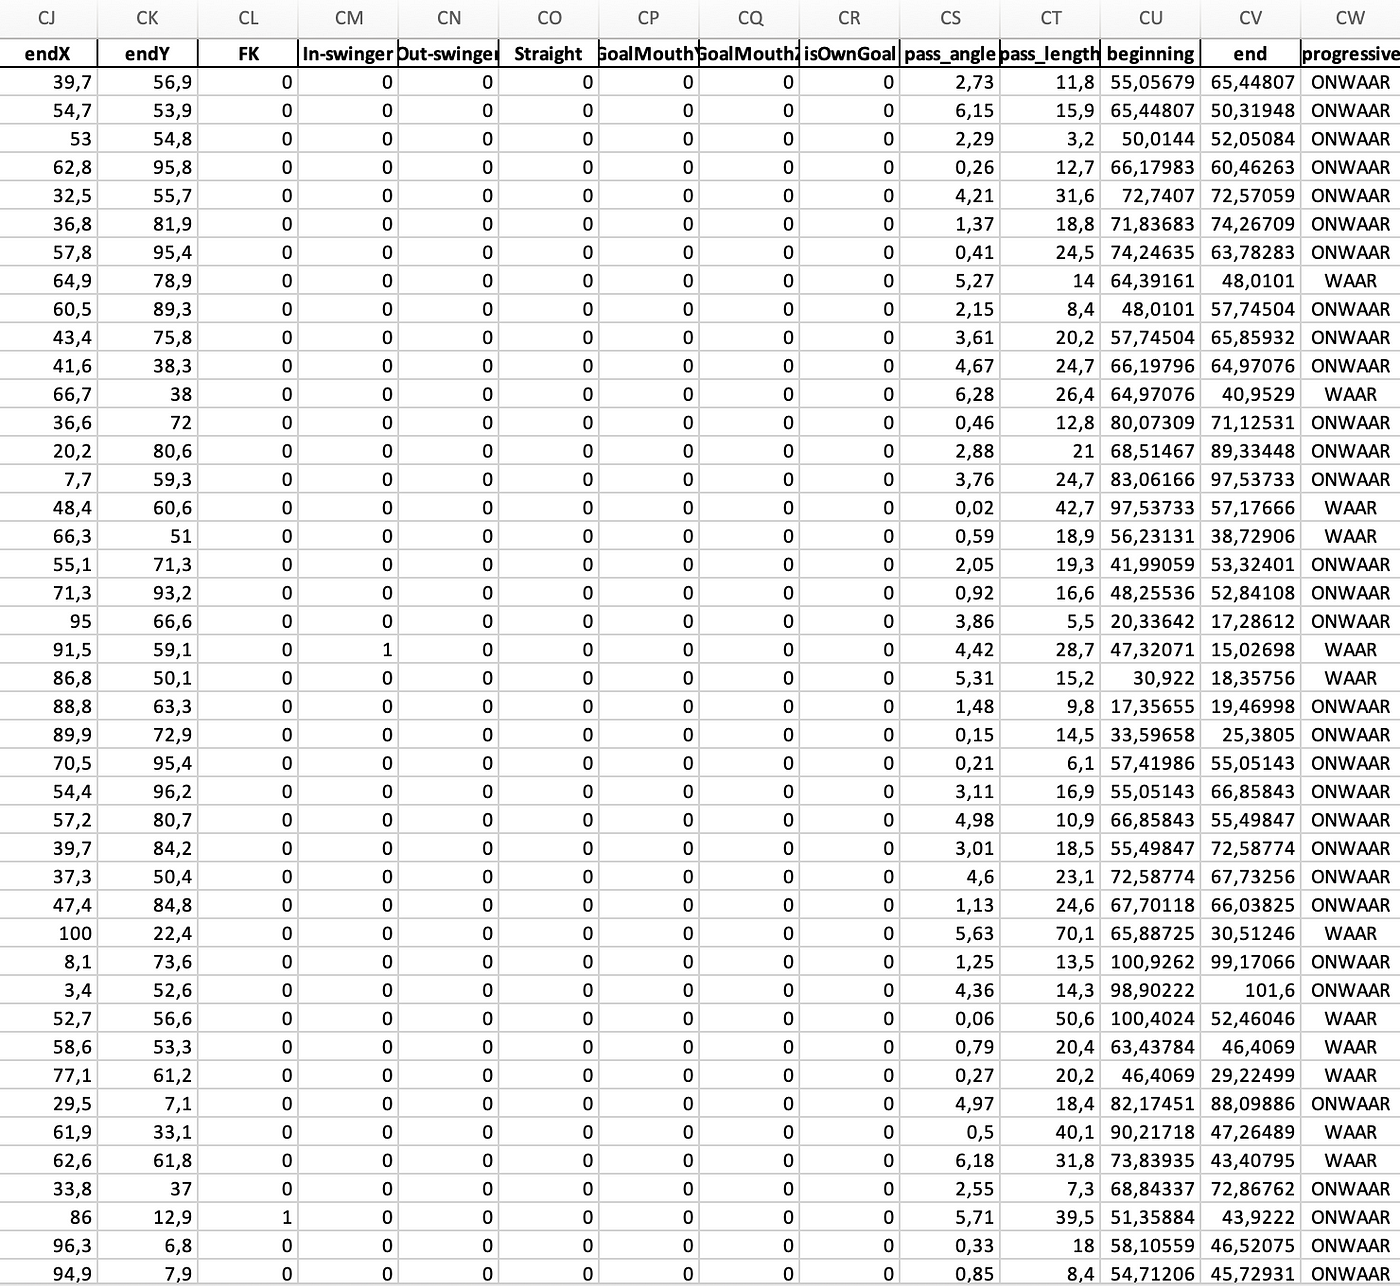
As you can see here, I’ve calculated the endX and endY, which are the endpoints. If I have the endpoints of the passes, I can draw passes and calculate what the progression is of those passes. This is important for the threat, as it helps me calculate the expected threat.
From this database, I will calculate the free kicks, the xG and the xT. I will explain why and how, below, but these metrics don’t exist at first and all need to be generated or created.
Data explainer
So, we got the provider we need. The next step is to look at the data and select the metrics we want to use. We want to look at what danger the delivery can give us and there are a few metrics that I want to generate for this analysis:
- The free kick: in the data, you can filter for free kicks taken in the games you are looking at it. There is a distinction between outswinging free kicks and inswinging free kicks. As well as there is between indirect and direct free kicks.
- Expected threat: what’s the expected threat of the cross/pass taken from the corner by the individual player?
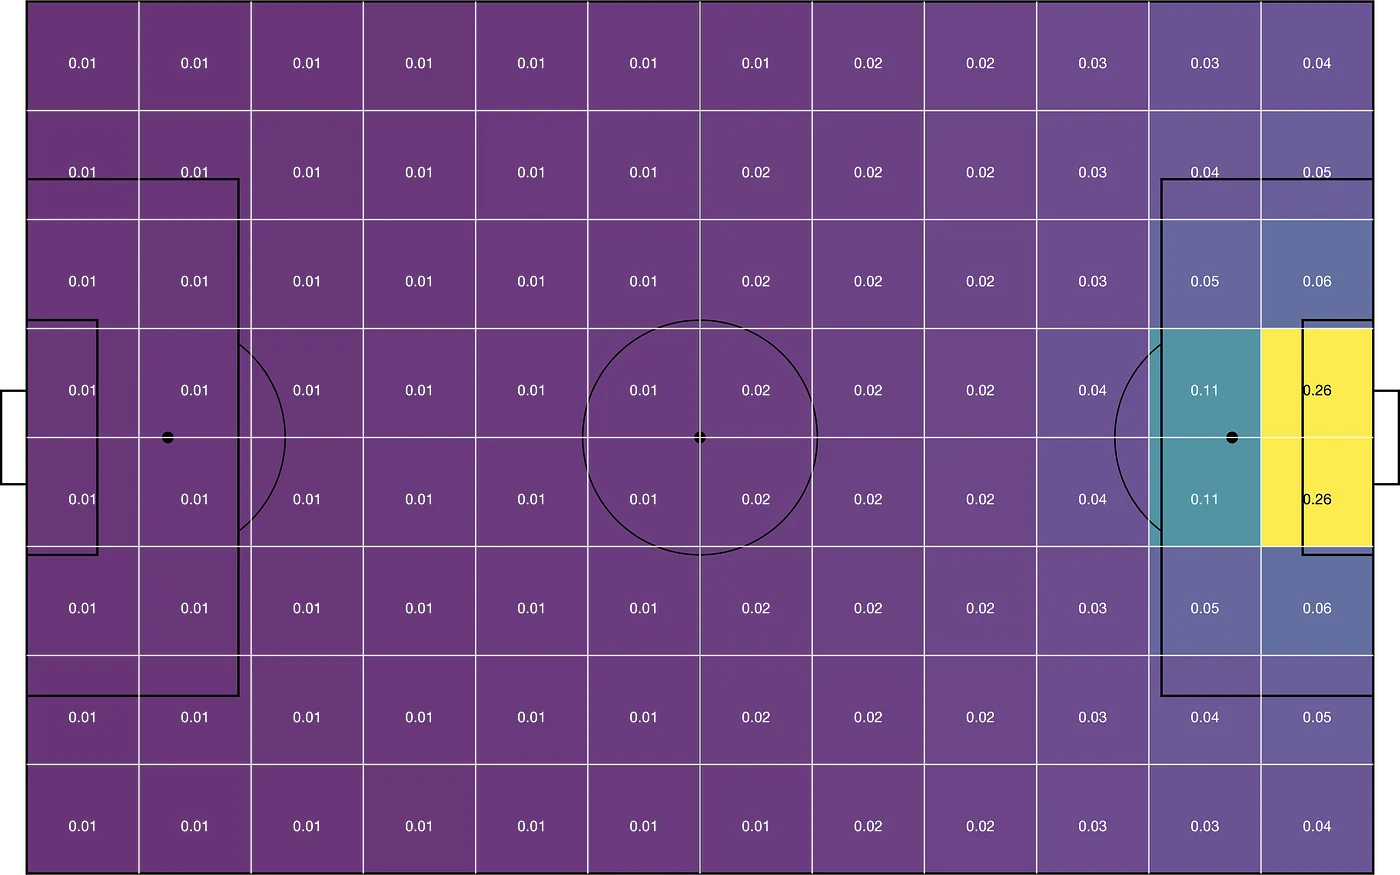
The basic idea behind xT is to divide the pitch into a grid, with each cell assigned a probability of an action initiated there to result in a goal in the next N actions. This approach allows us to value not only parts of the pitch from which scoring directly is more likely, but also those from which an assist is most likely to happen. Actions that move the ball, such as passes and dribbles (also referred to as ball carries), can then be valued based solely on their start and end points, by taking the difference in xT between the start and end cell. Basically, this term tells us which option a player is most likely to choose when in a certain cell, and how valuable those options are. The latter term is the one that allows xT to credit valuable passes that enable further actions such as key passes and shots. (Soccerment) - Expected goals: measures the quality of a chance by calculating the likelihood that it will be scored from a particular position on the pitch during a particular phase of play. This value is based on several factors from before the shot was taken.
- Zonal danger: measures the zonal danger of the endpoint of the free kick. This only happens if there is no direct contact from the free kick.
Methodology
So how do we go from raw positional data to a score? There are four important steps to take in which many things need to be thought of, otherwise, it won’t grasp what we are trying to do.
It’s also important to stress this is only about indirect free kicks. In the data we are not able to distinguish between in passes, but direct free kicks can be counted as shots, so we filter them out like that. So every pass coming from this event, is a indirect free kick pass.
The first step is to generate what we need from the event data to make metrics. First of all, we need to make sure that the passes we are looking at are only free kicks. And from that we essentially produce three different free kicks:
- Inswinging free kicks
- Outswinging free kicks
- Straight free kicks
After we have done that we have the basics ready because we have the free kicks. Next, we have to look at the expected threat. We calculate the expected threat from the passes and use a grid to determine the threat.
We use the beginning location of the corner and the end location. We calculate if the endpoint is a positive or negative value based on the grids and the starting point. For example, from a free kick from the deep central area in the opposition’s half to the half-space outside the penalty area is a positive xT, but from a free kick from that same location to the six-yard box in your own penalty area is a negative xT value.
Shots are already in our database, but we need to make a distinction between shots that are the result of direct contact with the free kicks and shots that follow in the next phases after a free kick.
The expected goals are calculated from the shots in the event data. They are run through a model that is trained by 400.000 shots. This model assigns xG by looking at the shooter and the locations of the shooter in combination with different variables like shot location, shot situation, game situation, body part, how it is assisted, and the game state. This model is its own and will be less accurate than Statsbomb, Opta or Wyscout models, but it still gives a pretty good indication of what we can expect.
The second step is to grab the metrics that we use and put them into the same kind of variables so we can calculate a score. This is needed because every variable has its different numerical value.

To create a score that goes from 0–1 or 0–100, I have to make sure all the variables are of the same type of value. In this, I was looking for ways to do that and figured mathematical deviation would be best. Often we we think about percentile ranks, but this isn’t the best in terms of what we are looking for because we don’t want outliers to have a big effect on total numbers. I’ve written about it earlier:
I’ve taken z-scores because I think seeing how a player is compared to the mean instead of the average will help us better in processing the quality of said player and it gives a good tool to get every data metric in the right numerical outlet to calculate our score later on.
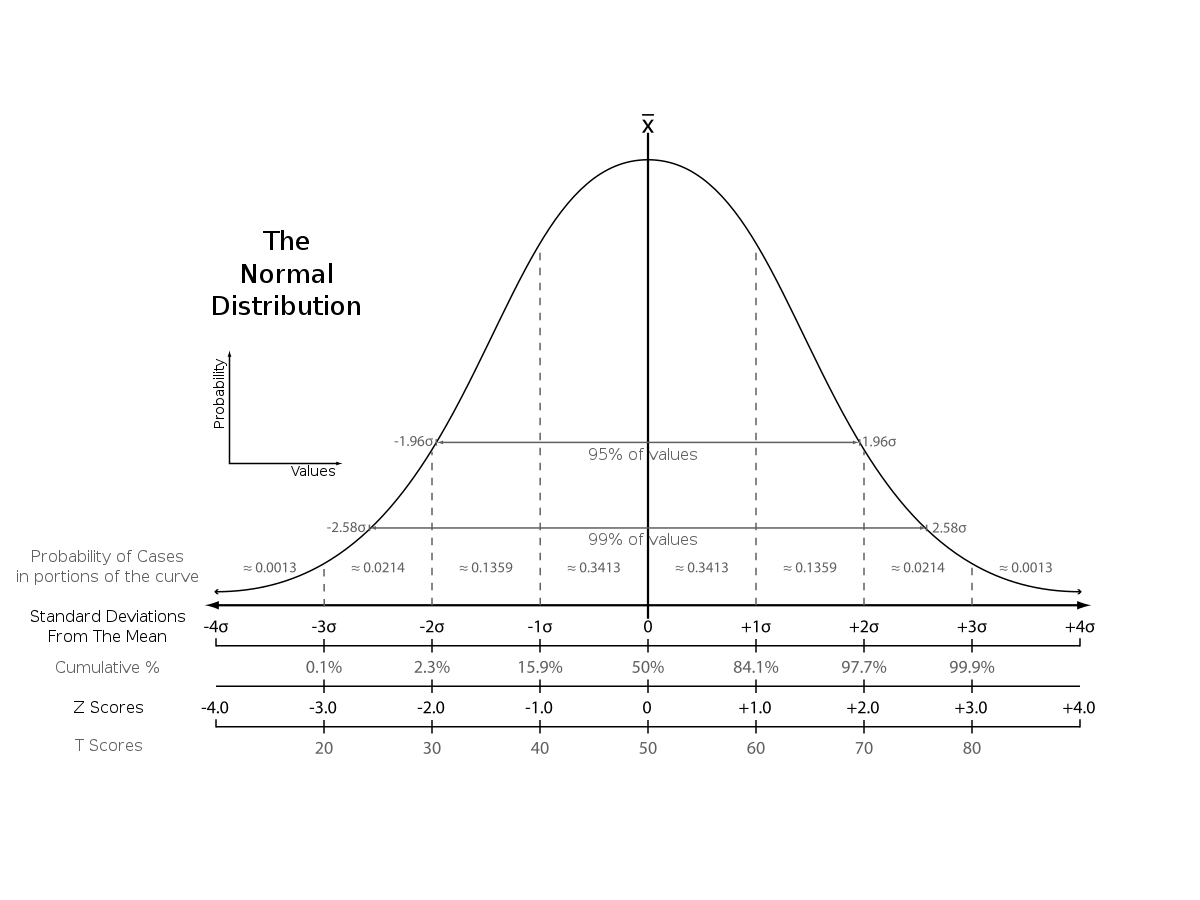
Z-scores vs other scores. Source: Wikipedia
We are looking for the mean, which is 0 and the deviations to the negative are players that score under the mean and the deviations are players that score above the mean. The latter are the players we are going to focus on in terms of wanting to see the quality. By calculating the z-scores for every metric, we have a solid ground to calculate our score.
The third step is to calculate the FTS. There are a few options you can use for that and you can also ready more about the mean, in this article by Ben Griffis:
We talk about harmonic, arithmetic, and geometric means when looking to create a score, but what are they?
The difference between Arithmetic mean, Geometric mean, and Harmonic Mean
As Ben describes, harmonic and arithmetic means are a good way of calculating an average mean for the metrics I’m using, but in my case, I want to look at something slightly different. The reason for that is that I want to weigh my metrics, as I think some are more important than others for the danger of the delivery.
So there are two different options for me. I either use filters and choose the harmonic mean as that’s the best way to do it, or I need to alter my complete calculation to find the mean. In this case, I’ve chosen to filter and then create the harmonic mean:
- Filter out negative xT values going back to a defender, goalkeeper or deep in midfield -> I want to calculate danger from the free kick
- Give different weights to the xT from a direct contact and shots from the second phase of free kicks-> these have to do with what’s happening in when the free kick lands in a more dangerous zone, but less with the delivery of that particular free kick
It’s important to stress that I’m looking for the most dangerous free kick deliveries and not the most efficient.
Using the harmonic mean now will lead to what I want to get out of it: a score from 0 to 100 that gives the danger coming from the delivery. It focuses on the advantage and added value of the free kick taker to possibly create a higher quality chance.
Metric use
FTS can be used for every player taking a corner in the game, but it’s not a metric that I would advise to use in isolation. It measures the delivery threat coming from a corner from the player taking a corner and it can be used very well on three different occasions:
- Analysing an individual player and focusing on individual coaching/training on how to improve their delivery.
- Analysing and concluding which delivery will be most successful in relation to the routines in set piece analysis a team will take.
- Setting your defence up against a player with a FTS — inswinging or outswinging — can help in preparing you for a game.
As you can see above the use of the metric is largely tailored to set piece analysis, set piece consulting and set piece coaching. It’s a metric that assists the basic set piece analysis and can really give more details into the actions of specific players during free kicks.
Quantity-adjusting: FTS per free kick

In the table above you can see the FTS for inswinging free kicks and these are scores for all the free kicks taken by the individual. The total threat is listed and you can see that some names pop up that you might expect and some that you don’t expect. 100 is the player with the highest threat from free kicks and 0,10 is the player with the lowest threat from free kicks.
Now this gives us an idea of the total FTS, but if we want to make it more representative we need to go one step back and calculate the FTS per inswinging free kick taken. This gives us a better image of whether a player is consistent in his threat via his delivery.
Example I: Eredivisie — Inswingers
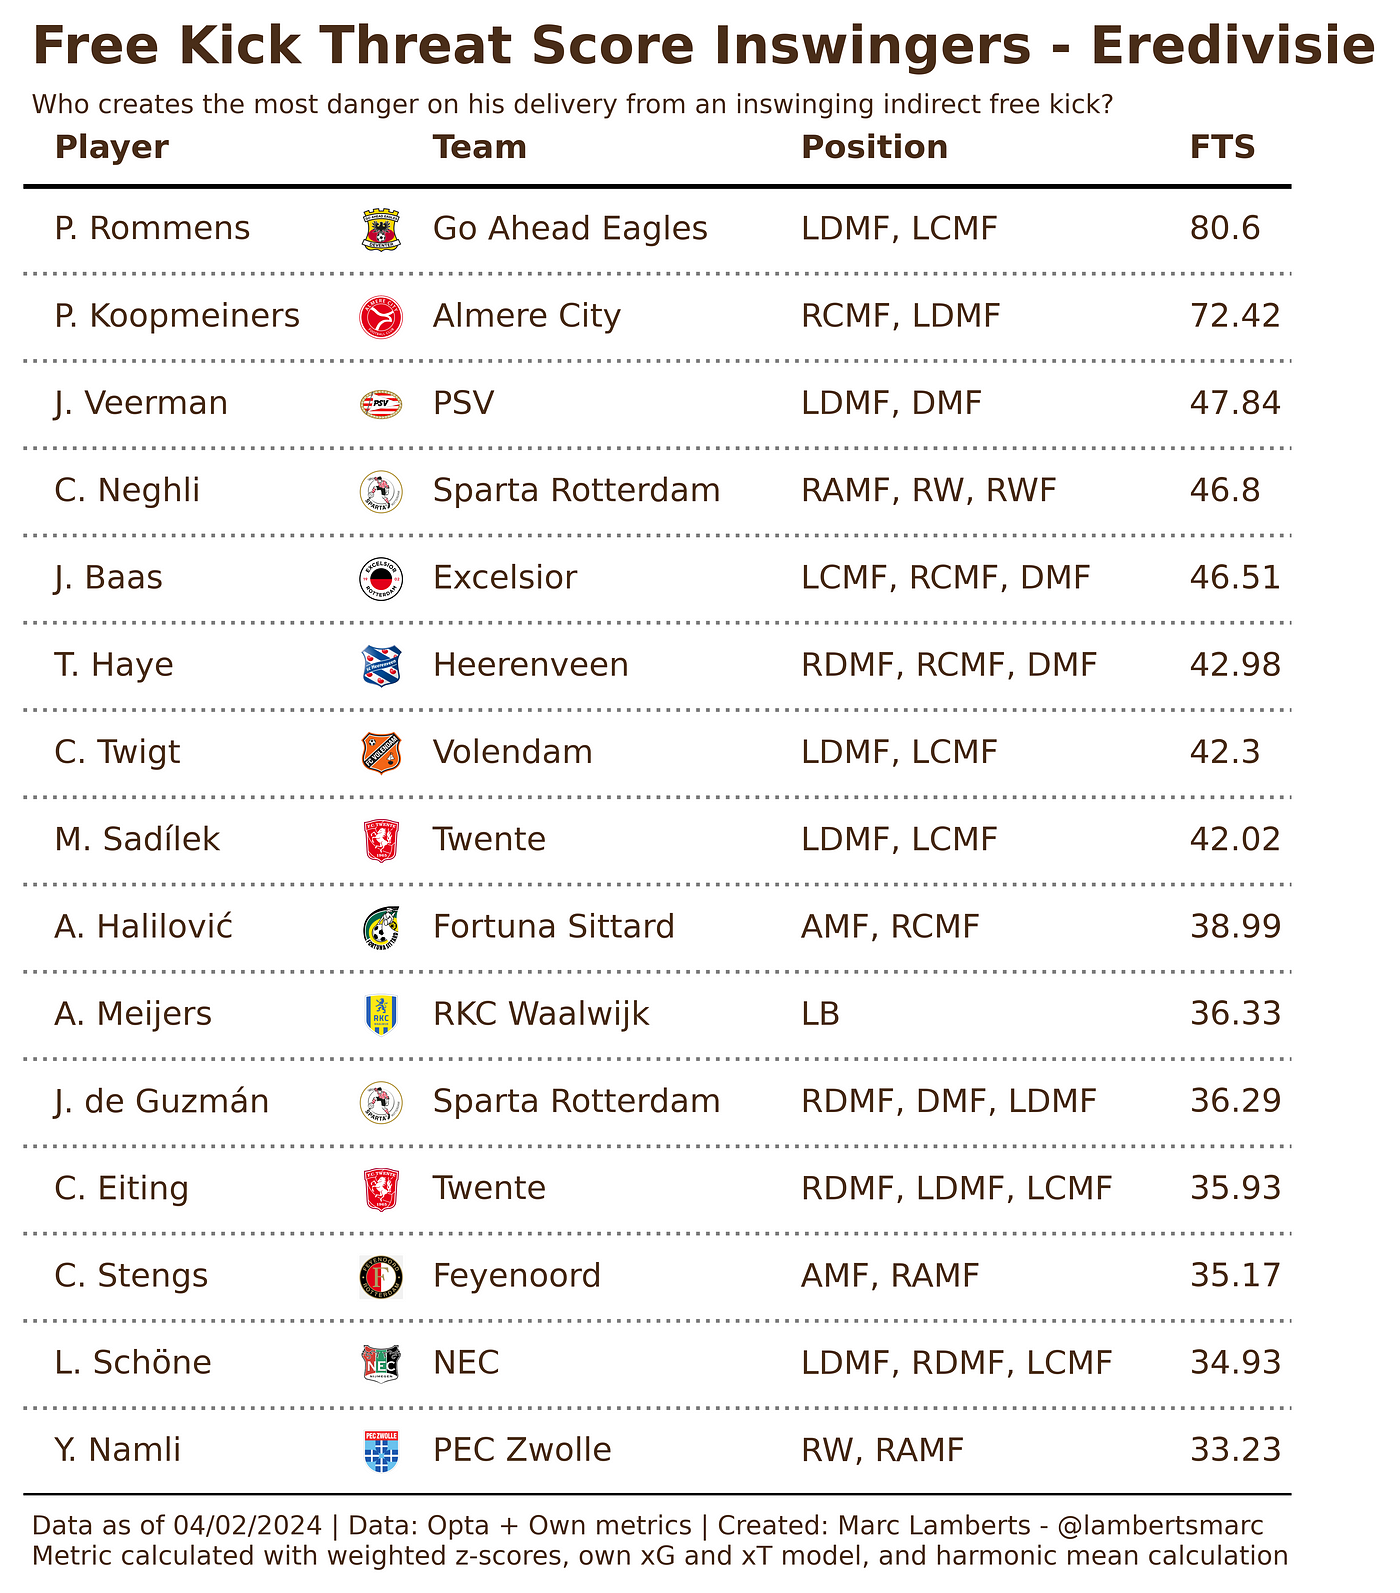
In the table above you can see the score of the players with the highest danger from inswinging free kicks. The score goes from 0–100 based on the players that take free kicks, with 100 being the score where the player scores highest in every metric included in the score.
As you can see Rommens from Go Ahead Eagles scores highest with 80,6, followed by Koopmeiners from Almere City with 72,42 and then we have a drop to 47,84 and we see Veerman from PSV.
These players create the highest threat and danger with ball swinging toward the goalkeeper and will likely be closer to the six-yard box. Their inside boot-kicking technique will likely be very important in striking the ball.
Example II: Eredivisie— Outswingers

In the table above you can see the score of the players with the highest danger from outswing free kicks. The score goes from 0–100 based on the players that actually take free kicks, with 100 being the score where the player scores highest in every metric included in the score.
As you can see Koopmeiners from Almere City scores highest with 74,73, followed by Rommens from Go Ahead Eagles with 68,3 and then we have Baas from Excelsior with 63,64.
These players create the highest threat and danger with ball swinging away from the goalkeeper and are often attacked by runners from deep. Their inside boot-kicking technique will likely be very important but will have more effect when they go deeper into the penalty area.
Challenges
There are quite a few challenges with designing and creating a new metric. But I would say there are a few difficult ones that can alter the legitimacy of this metric:
- The danger of free kicks taking short or quick are disregarded
- Difficulties in establishing the phases of free kicks
- It disregards defensive errors or solidity, which can affect the outcome of the metric. Also zonal defence vs man-marking.
- Tagging wrong events
- Lot of variables in how to generate the metrics, and whether I should have used t-scores over z-scores because the sample data is relatively small.
- The length/distance to goal from the free kick. This has its effect on the danger
What’s next: Throw-in Press Score
Inspirations:
https://bengriffis.com/
https://karun.in/blog/expected-threat.html
https://www.gettingbluefingers.com/